HOT TOPICS LIST
- MACD
- Fibonacci
- RSI
- Gann
- ADXR
- Stochastics
- Volume
- Triangles
- Futures
- Cycles
- Volatility
- ZIGZAG
- MESA
- Retracement
- Aroon
INDICATORS LIST
LIST OF TOPICS
PRINT THIS ARTICLE
by Kevin Hopson
Crude oil is once again testing key resistance at the $100 level, but market sentiment and the long-term uptrend may point to an eventual breakout.
Position: Hold
Kevin Hopson
Kevin has been a technical analyst for roughly 10 years now. Previously, Kevin owned his own business and acted as a registered investment advisor, specializing in energy. He was also a freelance oil analyst for Orient Trading Co., a commodity futures trading firm in Japan. Kevin is currently a freelance writer.
PRINT THIS ARTICLE
CHART ANALYSIS
Crude's Trading Range
02/20/08 03:45:26 PMby Kevin Hopson
Crude oil is once again testing key resistance at the $100 level, but market sentiment and the long-term uptrend may point to an eventual breakout.
Position: Hold
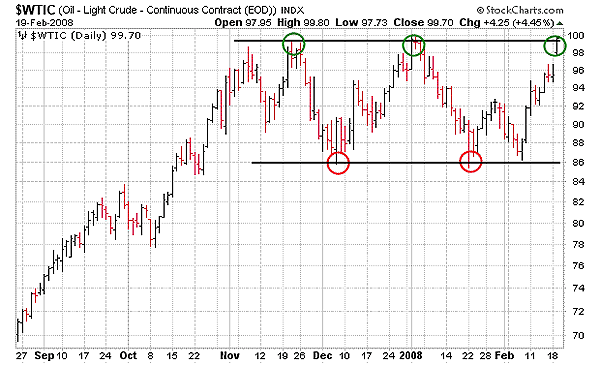
| Some traders may have been shocked to see crude oil approaching $100 a barrel early last November. However, what may be even more surprising is that oil prices have failed to back off from this level in recent months. As you can see in the six-month chart (Figure 1), the crude oil continuous contract has been stuck in a trading range ($86.00–$100.00) the last three and a half months. The reason crude has been finding stiff resistance at the $100 level is due in part to option open interest. |

|
| FIGURE 1: $WTIC, DAILY. The crude oil continuous contract has been stuck in a trading range the last three and a half months. |
| Graphic provided by: StockCharts.com. |
| |
| For example, if we look at call option open interest for the April 2008 contract, which will be the new front-month contract on February 21, the largest position (19,246 contracts) currently resides at the $100 strike price. Because there are only 250 put contracts open at this strike price, there is a net call position of 18,996 contracts. This is by far the largest net call position at any strike price for the April 2008 contract. Since the sellers of these call options have incentive to keep prices below $100 (by selling or going short), they can effectively put a cap on prices. We are seeing a similar pattern with the May contract as well. |
| That being said, market sentiment is not indicative of a significant top here. The Commitments of Traders report, which measures the weekly trading activity of commercials (usually considered the smart money) and noncommercials (large speculators) shows some pessimism creeping into the marketplace. Over the last four weeks, the bullish percent (long positions as a percentage of total positions) for commercials has been steady around 49%. |
| However, the bullish percent for noncommercials has dropped from 61% to 55%. Noncommercials tend to have a herd mentality, which means they will buy into strength and help fuel rallies. When these traders start to turn more bearish, it creates more potential buying pressure in the marketplace (much like short-covering), as noncommercials will rush to buy once prices break out. |
| In addition, because trading ranges typically act as continuation patterns and the trend was positive prior to this formation, there is a good chance that prices will break to the upside. If so, the trading range pattern currently indicates an upside target of $128–142. Please refer to my recent article on TXCO Resources for information on calculating trading range price targets. As of right now, nothing is certain, but the developing situation warrants watching. |
Kevin has been a technical analyst for roughly 10 years now. Previously, Kevin owned his own business and acted as a registered investment advisor, specializing in energy. He was also a freelance oil analyst for Orient Trading Co., a commodity futures trading firm in Japan. Kevin is currently a freelance writer.
| Glen Allen, VA | |
| E-mail address: | hopson_1@yahoo.com |
Click here for more information about our publications!
Comments
Date: 02/21/08Rank: 4Comment:

Request Information From Our Sponsors
- StockCharts.com, Inc.
- Candle Patterns
- Candlestick Charting Explained
- Intermarket Technical Analysis
- John Murphy on Chart Analysis
- John Murphy's Chart Pattern Recognition
- John Murphy's Market Message
- MurphyExplainsMarketAnalysis-Intermarket Analysis
- MurphyExplainsMarketAnalysis-Visual Analysis
- StockCharts.com
- Technical Analysis of the Financial Markets
- The Visual Investor
- VectorVest, Inc.
- Executive Premier Workshop
- One-Day Options Course
- OptionsPro
- Retirement Income Workshop
- Sure-Fire Trading Systems (VectorVest, Inc.)
- Trading as a Business Workshop
- VectorVest 7 EOD
- VectorVest 7 RealTime/IntraDay
- VectorVest AutoTester
- VectorVest Educational Services
- VectorVest OnLine
- VectorVest Options Analyzer
- VectorVest ProGraphics v6.0
- VectorVest ProTrader 7
- VectorVest RealTime Derby Tool
- VectorVest Simulator
- VectorVest Variator
- VectorVest Watchdog
