HOT TOPICS LIST
- MACD
- Fibonacci
- RSI
- Gann
- ADXR
- Stochastics
- Volume
- Triangles
- Futures
- Cycles
- Volatility
- ZIGZAG
- MESA
- Retracement
- Aroon
INDICATORS LIST
LIST OF TOPICS
PRINT THIS ARTICLE
by Chaitali Mohile
The gap up brings a twist in the bearish story of CMCSA. A previous gap down was filled and the stock is more likely to enter the uptrend.
Position: Buy
Chaitali Mohile
Active trader in the Indian stock markets since 2003 and a full-time writer. Trading is largely based upon technical analysis.
PRINT THIS ARTICLE
GAPS
Valentine's Day Gift By CMCSA
02/26/08 01:53:41 PMby Chaitali Mohile
The gap up brings a twist in the bearish story of CMCSA. A previous gap down was filled and the stock is more likely to enter the uptrend.
Position: Buy
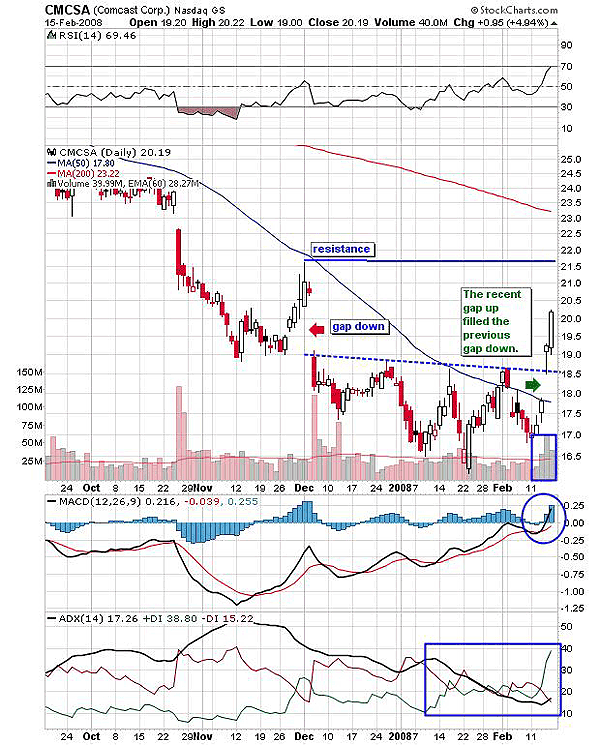
| CMCSA had a fast-forward correction with two gaps down, first in late October 2007 and later in early December 2007. The second gap down was wider compared to the earlier, and created a strong resistance at 18.5, which was frequently targeted for breakout. The direction and positions of both the moving averages (50-day and 200-day) also signify the bears' hold on the stock. The price has constantly remained under the dark shadow of a 50-day moving average, dragging the stock lower. Therefore, along with the trendline resistance, the 50-day MA is another hurdle for the bullish breakout. The gap breakout on February 14 was a Valentine's Day gift to the traders by violating both the resistance and offering fresh long trades. See Figure 1. |
| The gap up, in addition, has filled the previous gap down, which again attracts traders to open new trading positions. This is part of the strategy to trade the gaps. In addition, this gap up is likely to bring a major trend reversal, according to the average directional movement index (ADX)(14). The bulls are trying their hands after a long downtrend. The positive directional index (+DI) has moved steeply over the negative directional index (-DI), and the ADX above 20 would indicate a developing uptrend. |

|
| FIGURE 1: CMCSA, DAILY. The gap up violated two strong resistance level at a time, and the previous gap down was also filled. The indicators that were weak earlier are turning bullish, supporting the gap-up breakout. |
| Graphic provided by: StockCharts.com. |
| |
| Traders can enter the long position at the current level with a short-term target of 21.5. The upper shadow of the bullish candle before the earlier gap down would be the potential resistance, which I see as the first target for this breakout. Traders can also watch out for the bullish indication by the relative strength index (RSI)(14) and the moving average convergence/divergence (MACD) (12,26,9). The MACD is entering positive territory along with a bullish crossover. And the RSI (14) has surged in an overbought area, suggesting enough space for the bullish rally. |

|
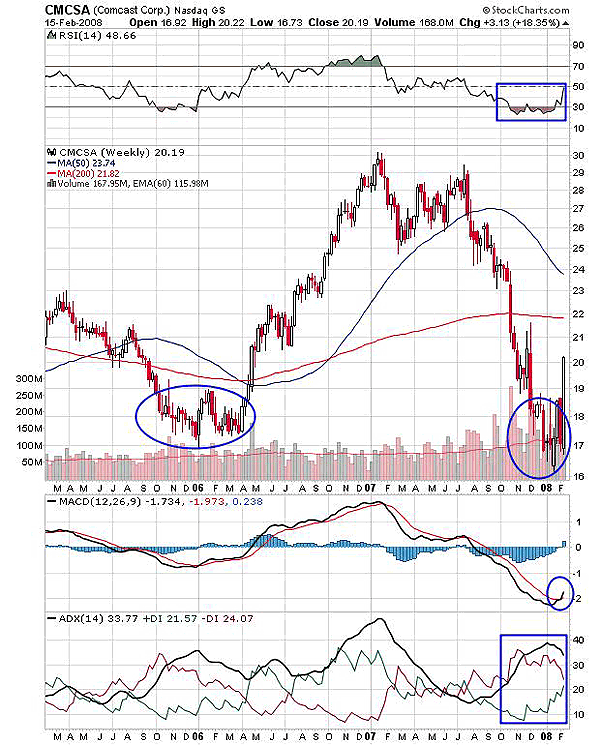
| FIGURE 2: CMCSA, WEEKLY. The stock dropped back to its previous support at lower levels, so the pullback rally easily hit its 200-day MA resistance. |
| Graphic provided by: StockCharts.com. |
| |
| The stock, on a weekly basis, has reached its prior low of 2005-06 (Figure 2). The stock has initiated an uptrend from this level and marked its all-time high at 30 in January 2007. At these levels all the indicators turned bearish; the RSI (14) was highly overbought, unable to sustain in the same area, ADX (14) touched it with overheated levels, which resulted in a serious correction. Now, the stock was back to a previous support zone, which offered strength for a pullback rally. In Figure 2, the indicators are showing a bullish interest to sustain the breakout and support the fresh buying decision of traders. The recent candles show a bullish engulfing pattern, which adds strength to this decision. Now regarding the target, Figure 2 has a 200-day MA resistance at 22, so profit-taking at this level is important. |
Active trader in the Indian stock markets since 2003 and a full-time writer. Trading is largely based upon technical analysis.
| Company: | Independent |
| Address: | C1/3 Parth Indraprasth Towers. Vastrapur |
| Ahmedabad, Guj 380015 | |
| E-mail address: | chaitalimohile@yahoo.co.in |
Traders' Resource Links | |
| Independent has not added any product or service information to TRADERS' RESOURCE. | |
Click here for more information about our publications!
Comments
Date: 02/27/08Rank: 5Comment:

Request Information From Our Sponsors
- StockCharts.com, Inc.
- Candle Patterns
- Candlestick Charting Explained
- Intermarket Technical Analysis
- John Murphy on Chart Analysis
- John Murphy's Chart Pattern Recognition
- John Murphy's Market Message
- MurphyExplainsMarketAnalysis-Intermarket Analysis
- MurphyExplainsMarketAnalysis-Visual Analysis
- StockCharts.com
- Technical Analysis of the Financial Markets
- The Visual Investor
- VectorVest, Inc.
- Executive Premier Workshop
- One-Day Options Course
- OptionsPro
- Retirement Income Workshop
- Sure-Fire Trading Systems (VectorVest, Inc.)
- Trading as a Business Workshop
- VectorVest 7 EOD
- VectorVest 7 RealTime/IntraDay
- VectorVest AutoTester
- VectorVest Educational Services
- VectorVest OnLine
- VectorVest Options Analyzer
- VectorVest ProGraphics v6.0
- VectorVest ProTrader 7
- VectorVest RealTime Derby Tool
- VectorVest Simulator
- VectorVest Variator
- VectorVest Watchdog
