HOT TOPICS LIST
- MACD
- Fibonacci
- RSI
- Gann
- ADXR
- Stochastics
- Volume
- Triangles
- Futures
- Cycles
- Volatility
- ZIGZAG
- MESA
- Retracement
- Aroon
INDICATORS LIST
LIST OF TOPICS
PRINT THIS ARTICLE
by Sean Moore
As the tech-laden Nasdaq Index nears the 2,000 mark on the 1-year anniversary of its 5,132 high, we're left wondering where the bottom lies.
Position: Sell
Sean Moore
Traders.com Staff Writer.
PRINT THIS ARTICLE
SUPPORT & RESISTANCE
Watch Out Below! Nasdaq support
03/12/01 10:44:25 AMby Sean Moore
As the tech-laden Nasdaq Index nears the 2,000 mark on the 1-year anniversary of its 5,132 high, we're left wondering where the bottom lies.
Position: Sell
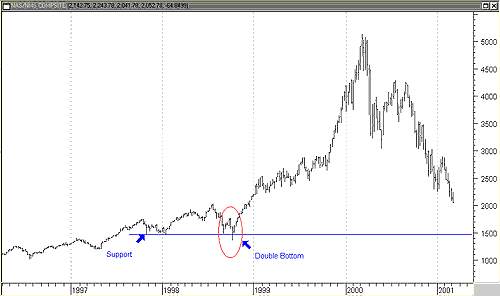
| The Nasdaq index has been plummeting through support levels of late. To find the next level of support you will need to look beyond a two-year chart. The Nasdaq has just broken below the low of 1999, which means you need to go back to 1998 for support. There is nice line of support through the low points of the double bottom that developed in September and October of 1998. This was the double bottom that started the year and a half Nasdaq bull ride. This support line is near 1,500. The line at 2,000 is a psychological line that could possess some support, but technically speaking, there is little support around 2,000. If, or when, the Nasdaq passes below the 2,000 mark, it will likely test the 1,500 support line that formed in the autumn of 1998, as shown in Figure 1. |
| Unfortunately, from a technical standpoint, it doesn't look like the Nasdaq has settled into a bottom. There are likely still some nice short-selling opportunities within the technology sector. If you're looking to go long, you may want to wait for a more prevalent bottom to develop. |

|
| Figure 1: Weekly chart for the Nasdaq 100 Index with the 1,500 support line and 1998ís double bottom. |
| Graphic provided by: MetaStock. |
| |
Traders.com Staff Writer.
| Title: | Project Engineer |
| Company: | Technical Analysis, Inc. |
| Address: | 4757 California Ave. SW |
| Seattle, WA 98116 | |
| Phone # for sales: | 206 938 0570 |
| Fax: | 206 938 1307 |
| Website: | Traders.com |
| E-mail address: | smoore@traders.com |
Traders' Resource Links | |
| Charting the Stock Market: The Wyckoff Method -- Books | |
| Working-Money.com -- Online Trading Services | |
| Traders.com Advantage -- Online Trading Services | |
| Technical Analysis of Stocks & Commodities -- Publications and Newsletters | |
| Working Money, at Working-Money.com -- Publications and Newsletters | |
| Traders.com Advantage -- Publications and Newsletters | |
| Professional Traders Starter Kit -- Software | |
Click here for more information about our publications!
Comments
Date:†03/13/01Rank:†5Comment:†

Request Information From Our Sponsors
- StockCharts.com, Inc.
- Candle Patterns
- Candlestick Charting Explained
- Intermarket Technical Analysis
- John Murphy on Chart Analysis
- John Murphy's Chart Pattern Recognition
- John Murphy's Market Message
- MurphyExplainsMarketAnalysis-Intermarket Analysis
- MurphyExplainsMarketAnalysis-Visual Analysis
- StockCharts.com
- Technical Analysis of the Financial Markets
- The Visual Investor
- VectorVest, Inc.
- Executive Premier Workshop
- One-Day Options Course
- OptionsPro
- Retirement Income Workshop
- Sure-Fire Trading Systems (VectorVest, Inc.)
- Trading as a Business Workshop
- VectorVest 7 EOD
- VectorVest 7 RealTime/IntraDay
- VectorVest AutoTester
- VectorVest Educational Services
- VectorVest OnLine
- VectorVest Options Analyzer
- VectorVest ProGraphics v6.0
- VectorVest ProTrader 7
- VectorVest RealTime Derby Tool
- VectorVest Simulator
- VectorVest Variator
- VectorVest Watchdog
