HOT TOPICS LIST
- MACD
- Fibonacci
- RSI
- Gann
- ADXR
- Stochastics
- Volume
- Triangles
- Futures
- Cycles
- Volatility
- ZIGZAG
- MESA
- Retracement
- Aroon
INDICATORS LIST
LIST OF TOPICS
PRINT THIS ARTICLE
by Chaitali Mohile
The retesting of neckline support converted to resistance and opened buying opportunities in a downtrend.
Position: Hold
Chaitali Mohile
Active trader in the Indian stock markets since 2003 and a full-time writer. Trading is largely based upon technical analysis.
PRINT THIS ARTICLE
REVERSAL
Chevron Group Offers Fresh Buying
02/21/08 09:58:11 AMby Chaitali Mohile
The retesting of neckline support converted to resistance and opened buying opportunities in a downtrend.
Position: Hold
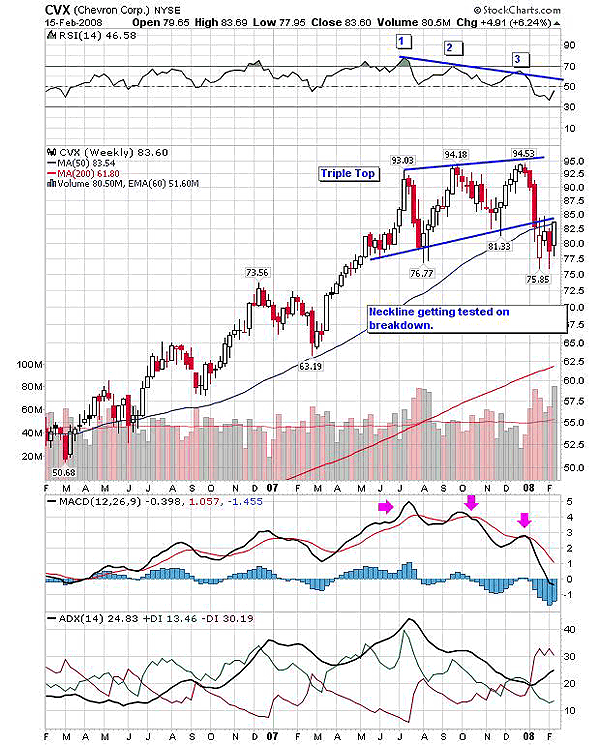
| A triple top is a long-term top reversal pattern. It is an extension of the double top as the stock bounces back to a third high close to the level of the previous high from the same support level. It is not necessary for all three peaks to be at the same level, but they must be relatively close. In Figure 1, Chevron Group formed three consecutive highs at 93.04, 94.18, and 94.53 with a neckline joining the valleys in between. The neckline support on the second valley coincided with the 50-day moving average. |

|
| FIGURE 1: CVX, WEEKLY. The triple-top neckline and 50-day moving average are the resistance that have frequently been tested. The trend still remains bearish and the RSI (14), MACD (12,26,9) are weak, too, so correction is on the cards. |
| Graphic provided by: StockCharts.com. |
| |
| The relative strength index (RSI)(14) gave a bearish indication supporting the top reversal pattern by forming lower highs. This negative divergence poured in required bearish pressure to break down below the the neckline support. The stock therefore turned the neckline support to resistance four weeks ago. Retesting resistance is normal for any pattern, though not necessary. In Figure 1, the stock is flirting with the neckline since the breakdown, and also with the 50-day MA. |
| The immediate resistance and increasing negative notes may result in more losses. The trend seen in Figure 1 has recently moved to favor the bears, increasing the sellers' pressure on the average directional movement index (ADX) (14). The indicator suggests a developed downtrend. The moving average convergence/divergence (MACD) (12,26,9) tried its best to make a move above the trigger line three times, but tumbled back and turned negative, boosting the bears. |

|
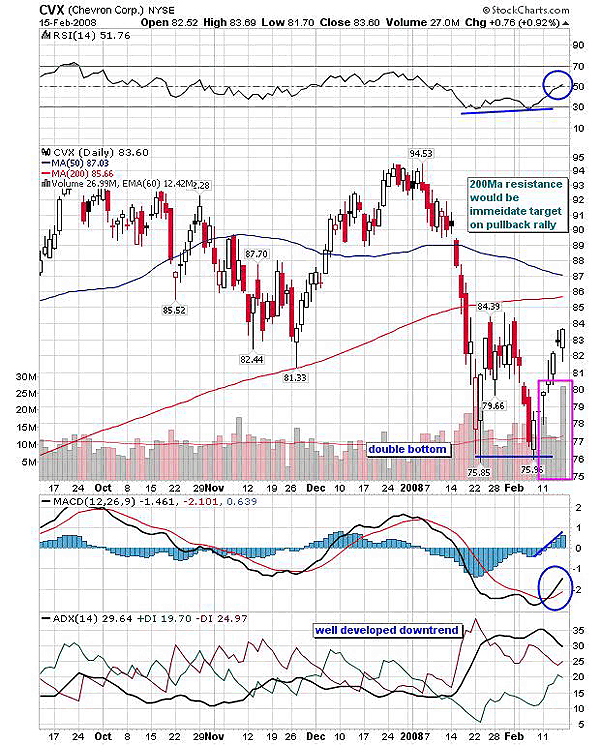
| FIGURE 2: CVX, DAILY. The double-bottom formation encouraged a good buying opportunity on a bullish view from momentum indicators. The 200-day moving average resistance would be the target for a long position. |
| Graphic provided by: StockCharts.com. |
| |
| The retesting of resistance opened a good buying opportunity for intraday traders, even during a developed downtrend on the daily chart. In Figure 2, the stock established around 75.85 levels, forming a double bottom under the pressure of a 200-day moving average. As the bullish reversal pattern of a double bottom was confirmed, the volume expanded. The RSI (14) gradually formed a double bottom, adding to the bullish strength. The MACD (12,2,6,9) is showing a bullish crossover, which supports the temporary pullback rally from the lower level. |
| It's a "temporary rally," as the trend shown by ADX (14) is still bearish. So this buying opportunity is a high-risk long position under the resistance of a 200-day moving average resistance. Therefore, this resistance would be an immediate target for the traders already long from 75. New long trades are not advisable at the current level, though RSI (14) is likely to move above 50. And I would not recommend any trade above the 200-day moving average under the bearish scenario across the financial markets. Hence, taking fast profits on the trade will be healthier. |
Active trader in the Indian stock markets since 2003 and a full-time writer. Trading is largely based upon technical analysis.
| Company: | Independent |
| Address: | C1/3 Parth Indraprasth Towers. Vastrapur |
| Ahmedabad, Guj 380015 | |
| E-mail address: | chaitalimohile@yahoo.co.in |
Traders' Resource Links | |
| Independent has not added any product or service information to TRADERS' RESOURCE. | |
Click here for more information about our publications!
Comments
Date: 02/21/08Rank: 4Comment:

Request Information From Our Sponsors
- StockCharts.com, Inc.
- Candle Patterns
- Candlestick Charting Explained
- Intermarket Technical Analysis
- John Murphy on Chart Analysis
- John Murphy's Chart Pattern Recognition
- John Murphy's Market Message
- MurphyExplainsMarketAnalysis-Intermarket Analysis
- MurphyExplainsMarketAnalysis-Visual Analysis
- StockCharts.com
- Technical Analysis of the Financial Markets
- The Visual Investor
- VectorVest, Inc.
- Executive Premier Workshop
- One-Day Options Course
- OptionsPro
- Retirement Income Workshop
- Sure-Fire Trading Systems (VectorVest, Inc.)
- Trading as a Business Workshop
- VectorVest 7 EOD
- VectorVest 7 RealTime/IntraDay
- VectorVest AutoTester
- VectorVest Educational Services
- VectorVest OnLine
- VectorVest Options Analyzer
- VectorVest ProGraphics v6.0
- VectorVest ProTrader 7
- VectorVest RealTime Derby Tool
- VectorVest Simulator
- VectorVest Variator
- VectorVest Watchdog
