HOT TOPICS LIST
- MACD
- Fibonacci
- RSI
- Gann
- ADXR
- Stochastics
- Volume
- Triangles
- Futures
- Cycles
- Volatility
- ZIGZAG
- MESA
- Retracement
- Aroon
INDICATORS LIST
LIST OF TOPICS
PRINT THIS ARTICLE
by Mike Carr, CMT
Chattem announced the voluntary recall of a product that gave consumers third degree burns -- and the stock remains strong.
Position: Buy
Mike Carr, CMT
Mike Carr, CMT, is a member of the Market Technicians Association, and editor of the MTA's newsletter, Technically Speaking. He is also the author of "Smarter Investing in Any Economy: The Definitive Guide to Relative Strength Investing," and "Conquering the Divide: How to Use Economic Indicators to Catch Stock Market Trends."
PRINT THIS ARTICLE
REL. STR COMPARATIVE
Sometimes Bad News Means Buy
02/15/08 09:52:01 AMby Mike Carr, CMT
Chattem announced the voluntary recall of a product that gave consumers third degree burns -- and the stock remains strong.
Position: Buy
| Chattem (CHTT) announced that consumers of its Icy Hot Heat Therapy reported that more than 1,800 consumers suffered first-, second-, and third-degree burns and skin irritation. The company will take a charge of $0.20-0.30 per share to cover the costs of the recall. Excluding the charge, Chattem still expects to earn $4 to $4.20 per share this year. Its other products include such well-known brands as the mouthwash ACT, medicated skin products Cortizone-10 and Gold Bond, and sleep aid Unisom. |
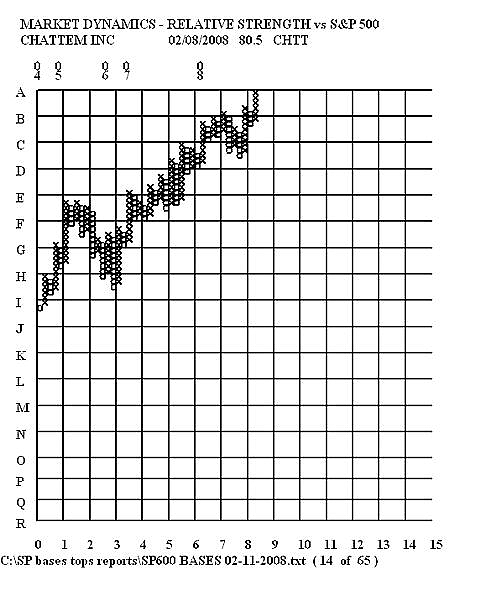
| While the news initially caused the stock price to decline slightly, CHTT rebounded and traded at a new 52-week high the next day. When bad news fails to hurt a stock, that is often a sign that the stock is headed higher. CHTT seems likely to move higher. This shows high relative strength, with no sign of an imminent reversal (Figure 1). |

|
| FIGURE 1: CHTT, P&F. The point & figure chart of relative strength is a useful technique to find stocks enjoying steady trends, like CHTT. |
| Graphic provided by: Market Dynamics. |
| |
| The point & figure chart of relative strength shows that CHTT has been rising steadily. For more than two years, the stock has made steady progress without becoming overbought on this chart. This is a healthy sign that the price rise is sustainable. |
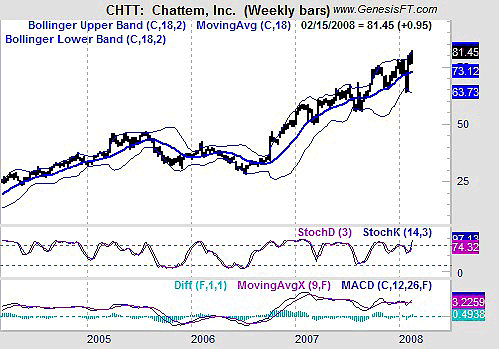
| More traditional indicators also support the conclusion that this price rise is sustainable (Figure 2). On the weekly chart, we see that the stock formed a large base in 2006 and has been a consistently strong stock since breaking out of that year long pattern. Stochastics has been overbought for most of that time. CHTT has walked along the upper Bollinger Band, setting new price highs along the way. |

|
| FIGURE 2: CHTT, WEEKLY. Strong stocks can show overbought oscillators for extended periods of time. Stochastics tends to remain overbought for CHTT. |
| Graphic provided by: Trade Navigator. |
| |
| Given the fact that the market shrugged off the product recall so easily, CHTT is likely headed higher. The January gap near 72 provides a good location for a stop, requiring a risk level of about 12% to buy this high-flying stock. |
Mike Carr, CMT, is a member of the Market Technicians Association, and editor of the MTA's newsletter, Technically Speaking. He is also the author of "Smarter Investing in Any Economy: The Definitive Guide to Relative Strength Investing," and "Conquering the Divide: How to Use Economic Indicators to Catch Stock Market Trends."
| Website: | www.moneynews.com/blogs/MichaelCarr/id-73 |
| E-mail address: | marketstrategist@gmail.com |
Click here for more information about our publications!
Comments
Date: 02/18/08Rank: 2Comment:

Request Information From Our Sponsors
- StockCharts.com, Inc.
- Candle Patterns
- Candlestick Charting Explained
- Intermarket Technical Analysis
- John Murphy on Chart Analysis
- John Murphy's Chart Pattern Recognition
- John Murphy's Market Message
- MurphyExplainsMarketAnalysis-Intermarket Analysis
- MurphyExplainsMarketAnalysis-Visual Analysis
- StockCharts.com
- Technical Analysis of the Financial Markets
- The Visual Investor
- VectorVest, Inc.
- Executive Premier Workshop
- One-Day Options Course
- OptionsPro
- Retirement Income Workshop
- Sure-Fire Trading Systems (VectorVest, Inc.)
- Trading as a Business Workshop
- VectorVest 7 EOD
- VectorVest 7 RealTime/IntraDay
- VectorVest AutoTester
- VectorVest Educational Services
- VectorVest OnLine
- VectorVest Options Analyzer
- VectorVest ProGraphics v6.0
- VectorVest ProTrader 7
- VectorVest RealTime Derby Tool
- VectorVest Simulator
- VectorVest Variator
- VectorVest Watchdog
