HOT TOPICS LIST
- MACD
- Fibonacci
- RSI
- Gann
- ADXR
- Stochastics
- Volume
- Triangles
- Futures
- Cycles
- Volatility
- ZIGZAG
- MESA
- Retracement
- Aroon
INDICATORS LIST
LIST OF TOPICS
PRINT THIS ARTICLE
by Arthur Hill
Despite a big surge in January, Pulte Homes hit resistance with an extended harami and looks ripe for a resumption of the bigger downtrend.
Position: Sell
Arthur Hill
Arthur Hill is currently editor of TDTrader.com, a website specializing in trading strategies, sector/industry specific breadth stats and overall technical analysis. He passed the Society of Technical Analysts (STA London) diploma exam with distinction is a Certified Financial Technician (CFTe). Prior to TD Trader, he was the Chief Technical Analyst for Stockcharts.com and the main contributor to the ChartSchool.
PRINT THIS ARTICLE
CANDLESTICK CHARTING
An Extended Harami For Pulte
02/14/08 04:19:44 PMby Arthur Hill
Despite a big surge in January, Pulte Homes hit resistance with an extended harami and looks ripe for a resumption of the bigger downtrend.
Position: Sell
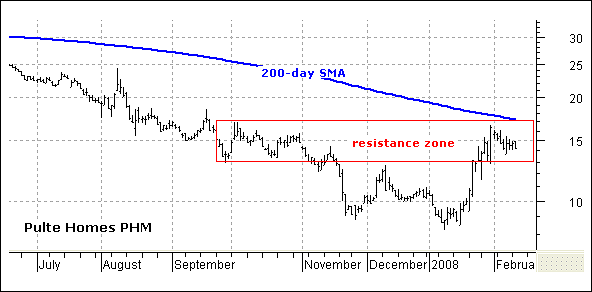
| Figure 1 shows Pulte Homes (PHM) since mid-2007. The stock declined to a new low in early January and then shot above 16 in late January. The move almost doubled the stock, but it met resistance around 15 and stalled the last two weeks. The red box shows a resistance zone from the October consolidation. The falling 200-day moving average marks resistance around 17. Since it is still falling, look for this moving average to a lower resistance level over the coming weeks. |

|
| FIGURE 1: PULTE HOMES. The stock declined to a new low in early January and then shot above 16 in late January. |
| Graphic provided by: MetaStock. |
| |
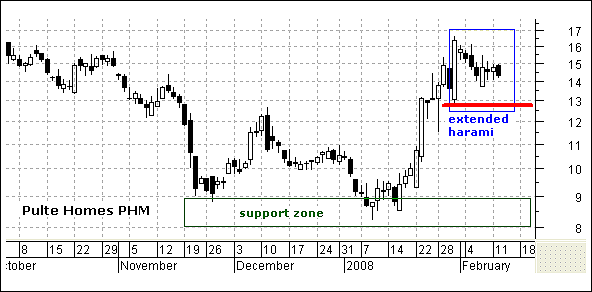
| Figure 2 focuses on support and the extended harami. The stock found support around 8–9 in late November and January. The surge off support ended with a long white candlestick on January 31. Trading since this long white candlestick has been within the high-low range from January 31. Basically, a normal harami formed after the long white candlestick and first inside day. The next seven days were also inside the long white candlestick range and this makes for an extended harami. |

|
| FIGURE 2: PULTE HOMES. The stock found support around 8 to 9 in late November through January. |
| Graphic provided by: MetaStock. |
| |
| The harami is a potentially bearish candlestick pattern that requires confirmation. The low of the long white candlestick marks support at 12.80 and a break below this level would be bearish. The obvious target is the support zone around 8–9. With a clear downtrend under way, it is very possible that PHM will go on to forge a lower low. |
Arthur Hill is currently editor of TDTrader.com, a website specializing in trading strategies, sector/industry specific breadth stats and overall technical analysis. He passed the Society of Technical Analysts (STA London) diploma exam with distinction is a Certified Financial Technician (CFTe). Prior to TD Trader, he was the Chief Technical Analyst for Stockcharts.com and the main contributor to the ChartSchool.
| Title: | Editor |
| Company: | TDTrader.com |
| Address: | Willem Geetsstraat 17 |
| Mechelen, B2800 | |
| Phone # for sales: | 3215345465 |
| Website: | www.tdtrader.com |
| E-mail address: | arthurh@tdtrader.com |
Traders' Resource Links | |
| TDTrader.com has not added any product or service information to TRADERS' RESOURCE. | |
Click here for more information about our publications!
Comments
Date: 02/18/08Rank: 4Comment:

Request Information From Our Sponsors
- StockCharts.com, Inc.
- Candle Patterns
- Candlestick Charting Explained
- Intermarket Technical Analysis
- John Murphy on Chart Analysis
- John Murphy's Chart Pattern Recognition
- John Murphy's Market Message
- MurphyExplainsMarketAnalysis-Intermarket Analysis
- MurphyExplainsMarketAnalysis-Visual Analysis
- StockCharts.com
- Technical Analysis of the Financial Markets
- The Visual Investor
- VectorVest, Inc.
- Executive Premier Workshop
- One-Day Options Course
- OptionsPro
- Retirement Income Workshop
- Sure-Fire Trading Systems (VectorVest, Inc.)
- Trading as a Business Workshop
- VectorVest 7 EOD
- VectorVest 7 RealTime/IntraDay
- VectorVest AutoTester
- VectorVest Educational Services
- VectorVest OnLine
- VectorVest Options Analyzer
- VectorVest ProGraphics v6.0
- VectorVest ProTrader 7
- VectorVest RealTime Derby Tool
- VectorVest Simulator
- VectorVest Variator
- VectorVest Watchdog
