HOT TOPICS LIST
- MACD
- Fibonacci
- RSI
- Gann
- ADXR
- Stochastics
- Volume
- Triangles
- Futures
- Cycles
- Volatility
- ZIGZAG
- MESA
- Retracement
- Aroon
INDICATORS LIST
LIST OF TOPICS
PRINT THIS ARTICLE
by Alan R. Northam
The S&P 500 appears to indicate the market correction is nearing an end.
Position: Sell
Alan R. Northam
Alan Northam lives in the Dallas, Texas area and as an electronic engineer gave him an analytical mind from which he has developed a thorough knowledge of stock market technical analysis. His abilities to analyze the future direction of the stock market has allowed him to successfully trade of his own portfolio over the last 30 years. Mr. Northam is now retired and trading the stock market full time. You can reach him at inquiry@tradersclassroom.com or by visiting his website at http://www.tradersclassroom.com. You can also follow him on Twitter @TradersClassrm.
PRINT THIS ARTICLE
TECHNICAL ANALYSIS
Market Correction Nearing End
02/15/08 08:29:05 AMby Alan R. Northam
The S&P 500 appears to indicate the market correction is nearing an end.
Position: Sell
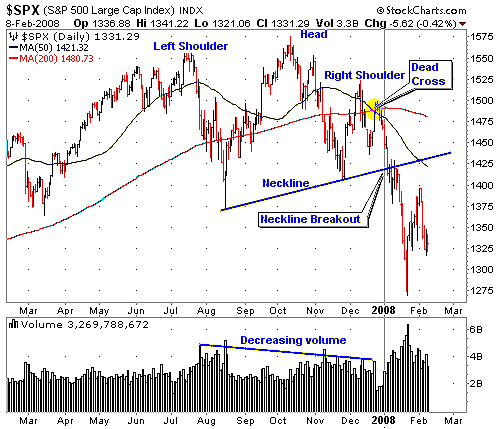
| In late December 2007 and early January 2008 the Standard & Poor's 500 provided two signals that the bull market has ended and a new bear market was under way. The first signal came when the 50-day moving average crossed under the 200-day moving average, known as a "dead cross," and signaled the end of the previous uptrend and the beginning of a new downtrend. The second signal came when the neckline of a head & shoulders reversal pattern was penetrated. A head & shoulders reversal pattern is formed when there is a price peak surrounded by lower price peaks on either side. The price peak becomes the head, the lower price peak to the left of the head becomes the left shoulder, and the price peak to the right of the head becomes the right shoulder. A neckline is then drawn off the price lows between the two shoulders and the head. When the price falls below this neckline (neckline breakout), the head & shoulders trend reversal pattern is complete and signals that a reversal in trend has occurred. See Figure 1. |

|
| FIGURE 1: S&P 500. The S&P 500 shows the head & shoulder trend reversal pattern. |
| Graphic provided by: StockCharts.com. |
| |
| Once a market, such as the S&P 500, has been identified as being in a new bear market trend, all upward price rallies are considered to be countertrend rallies that move against the main downtrend. Countertrend rallies are short-lived and usually end at certain resistance levels. Over the last few weeks the S&P 500 has been moving higher off the early 2008 low in a countertrend rally that has since peaked and now appears to be headed back down. As traders, how would we have known when to expect this countertrend rally to end and the bear market downtrend to resume? To answer this question, we need to look at Figure 2. |

|
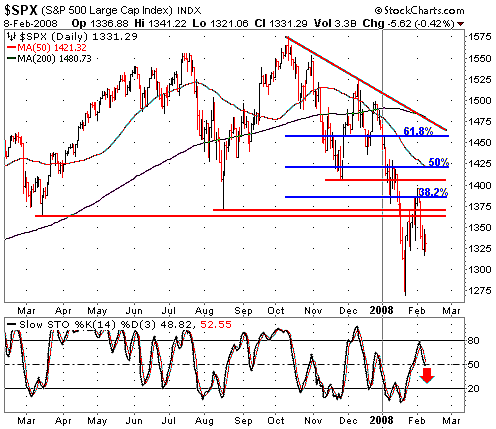
| FIGURE 2: S&P 500. The S&P 500 is showing resistance price levels and a 14-day slow stochastic oscillator. |
| Graphic provided by: StockCharts.com. |
| |
| In Figure 2, I have drawn resistance levels, red horizontal lines, off the price low from mid-March 2007, off of the price low from mid-August 2007, and off the price low from late November 2007. I have also drawn the red downward-sloping trendline from the mid-October 2007 high. I have also added the 50-day and 200-day simple moving averages that also act as lines of resistance when the market is trading below them. In addition to these resistance levels, I have added the Fibonacci retracement levels, blue lines. From his own studies, the mathematician Fibonacci came up with a set of guidelines, one of them stating that markets typically retrace from 38.2% to 61.8% of its recent move, with 50% being the most typical. |
| As traders we can expect the market such as the S&P 500 to trade up to one of these retracement levels, bounce off it, turn, and start trading lower once again. However, we do not know which one of these resistance levels it will be. So to help identify which of these retracement levels might be the correct one to turn the market around, I have incorporated the stochastic oscillator, a sensitive momentum indicator, into the analysis. As the countertrend rally moves higher off the early 2008 lows, the stochastic oscillator moves upward as well. However, when the S&P 500 hit the resistance level that turned this market back down, the stochastic oscillator turned downward as well. Note in Figure 2 that when the market traded up to the first and second red horizontal resistance lines drawn off the March 2007 and August 2007 lows, the stochastic oscillator kept right on moving higher. These resistance levels were not strong enough to turn the S&P 500 back downward. However, when the S&P 500 traded higher into the 38.2% Fibonacci retracement level, note that the stochastic oscillator turned back down, as did the S&P 500. Thus the stochastic oscillator confirmed that the 38.2% Fibonacci retracement level was strong enough to turn back the S&P 500. |
| One final comment: With the S&P 500 now trading back in a downward direction, how are we to know it will not turn back upward and rally higher instead of moving lower, making a new lower low? Again we must default to the stochastic oscillator. As long as the stochastic oscillator continues to move down, there is sufficient momentum in the market to keep it moving lower. A final confirmation that the countertrend bear market correction is over and the bear market downward trend has resumed comes when the S&P 500 closes below the early 2008 low. |
Alan Northam lives in the Dallas, Texas area and as an electronic engineer gave him an analytical mind from which he has developed a thorough knowledge of stock market technical analysis. His abilities to analyze the future direction of the stock market has allowed him to successfully trade of his own portfolio over the last 30 years. Mr. Northam is now retired and trading the stock market full time. You can reach him at inquiry@tradersclassroom.com or by visiting his website at http://www.tradersclassroom.com. You can also follow him on Twitter @TradersClassrm.
| Garland, Tx | |
| Website: | www.tradersclassroom.com |
| E-mail address: | inquiry@tradersclassroom.com |
Click here for more information about our publications!
Comments
Date: 02/18/08Rank: 3Comment:

Request Information From Our Sponsors
- StockCharts.com, Inc.
- Candle Patterns
- Candlestick Charting Explained
- Intermarket Technical Analysis
- John Murphy on Chart Analysis
- John Murphy's Chart Pattern Recognition
- John Murphy's Market Message
- MurphyExplainsMarketAnalysis-Intermarket Analysis
- MurphyExplainsMarketAnalysis-Visual Analysis
- StockCharts.com
- Technical Analysis of the Financial Markets
- The Visual Investor
- VectorVest, Inc.
- Executive Premier Workshop
- One-Day Options Course
- OptionsPro
- Retirement Income Workshop
- Sure-Fire Trading Systems (VectorVest, Inc.)
- Trading as a Business Workshop
- VectorVest 7 EOD
- VectorVest 7 RealTime/IntraDay
- VectorVest AutoTester
- VectorVest Educational Services
- VectorVest OnLine
- VectorVest Options Analyzer
- VectorVest ProGraphics v6.0
- VectorVest ProTrader 7
- VectorVest RealTime Derby Tool
- VectorVest Simulator
- VectorVest Variator
- VectorVest Watchdog
