HOT TOPICS LIST
- MACD
- Fibonacci
- RSI
- Gann
- ADXR
- Stochastics
- Volume
- Triangles
- Futures
- Cycles
- Volatility
- ZIGZAG
- MESA
- Retracement
- Aroon
INDICATORS LIST
LIST OF TOPICS
PRINT THIS ARTICLE
by Paolo Pezzutti
The stock has been hit by bad news underperforming the sector. Buying supports could be a profitable strategy.
Position: Buy
Paolo Pezzutti
Author of the book "Trading the US Markets - A Comprehensive Guide to US Markets for International Traders and Investors" - Harriman House (July 2008)
PRINT THIS ARTICLE
HEAD & SHOULDERS
Citigroup Is A Buy Opportunity
02/11/08 10:43:14 AMby Paolo Pezzutti
The stock has been hit by bad news underperforming the sector. Buying supports could be a profitable strategy.
Position: Buy
| The instabilities of summer 2007 were triggered by the crisis in the subprime mortgage lending in the US. The economic impact is evident and the Fed, lowering aggressively interest rates, is trying to help the system recover. The financial sector suffered the most, falling to the lowest price levels seen since 2003. Moreover, an economic recession could speed up the rising pace of defaults by borrowers, hurting companies with large-consumer and business-loan books. There is also a realization that the credit problems are not going away soon. My view, however, is that the flexibility and resiliency of the US economy once again will eventually manage to absorb the negative effects of the housing market crisis, although we have to expect bad news to continue for some time. This could be the case for Citigroup, whose shares were badly hit by the bear market of financials. In about nine months Citigroup lost more than 50% of its value, going back to prices seen in 2002 and 1998 (Figure 1). During the past six months, Citigroup has consistently underperformed the Financial Select Sector SPDR ETF (XLF). Citigroup lost 44% while the XLF went down 18%. The negative sentiment could drive Citigroup prices down, creating buying opportunities. See Figure 1. |

|
| FIGURE 1: CITIGROUP, MONTHLY. Prices lost more than 50% in less than a year. |
| Graphic provided by: TradeStation. |
| |
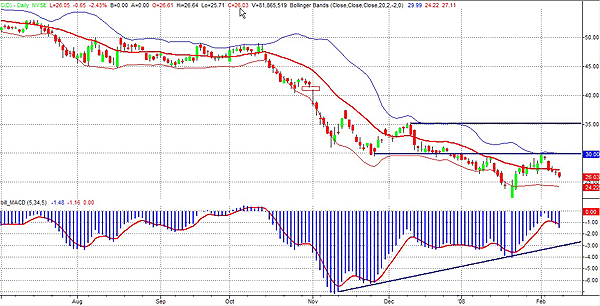
| In the daily time frame (Figure 2), you can see that Citigroup price has developed two positive divergences of the moving average convergence/divergence (MACD) indicator. We all know that divergences alone do not provide sufficient elements to justify a reversal. They have to be put in the context to weigh the risk-reward opportunities of a trade. On January 22, Citigroup opened with an impressive gap to the downside, which was closed by the end of the session. That was the start of a rebound that brought prices up to the resistance level of $30. In nine sessions, the stock recovered more than 30% from the low. Last week, Citigroup printed five consecutive negative closes losing more than 10%. However, in the past, after five consecutive closes to the downside, the stock closed up the next day 62% of the time. This is a very volatile market, which requires strong nerves if you want to be an active player and accept both risks and opportunities. A correction after such an impressive recovery has to be taken into account. We now have to monitor where prices manage to find support if you want to be a buyer and attempt to retest the $30 level. You can see that the Bollinger bands are parallel and horizontal at $24 and $30, respectively, which represent the key reference levels in this moment. There is no impulse ongoing. During this move to the downside, it is important that we do not see closes below the lower band, which would imply that another impulse will drive prices lower again. |

|
| FIGURE 2: CITIGROUP, DAILY. The MACD indicator has developed positive divergences, while resistance levels are identified at $30 and $35. |
| Graphic provided by: TradeStation. |
| |
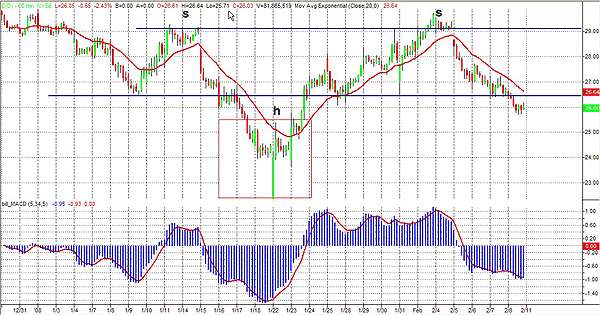
| In the 30-minute time frame (Figure 3), you can see that Citigroup is developing a bullish head & shoulders pattern. For the pattern to be confirmed, from here we should see the breakout of the $29–30 level. The objective would be in the $35 area, which is a resistance also in the daily time frame. When these chart formations develop, you have to make the choice whether you want to open the trade when the pattern is confirmed or you want to anticipate the signal and enter ahead of the market. In this case, price is testing the support of the shoulder at $26–27. This support is critical for the stock and next support would be down at the $25 level. Should you wait for the breakout of the neckline at $29–30, you could either enter at the breakout or after the breakout during a pullback. With the objective of the head & shoulder formation at $35, you would have a profit of $5 and a risk of $3–4, depending where you place the stop-loss. An alternative would be to be more aggressive and enter now that prices are testing their support. Of course, risk and possibilities of a loss are higher, but the reward makes the trade interesting. In fact, entering here you would have a potential profit of $9. If price continues to the downside, the pattern would not be confirmed and you would close it with a loss, but the risk-reward ratio at this level is more convenient. I would look for ratios of about 3 when opening a trade. |

|
| FIGURE 3: CITIGROUP, 60-MINUTE. The stock is developing a bullish head & shoulder formation. If confirmed, the objective would be at $35. |
| Graphic provided by: TradeStation. |
| |
| Opening a trade is the result of a tradeoff between risk and reward. The more information you want before opening the trade (breakout, pullback, and so forth), the lower the profit potential of the trade. If you accept to have less information your risk is higher, but the potential reward compensates the risk you may want to take. Where you open a trade depends very much on your trading style and how you feel comfortable from the psychological perspective. It is important, however, that you plan your trade conscious of all elements in terms of profit potential and risk and that you execute the plan with discipline. |
Author of the book "Trading the US Markets - A Comprehensive Guide to US Markets for International Traders and Investors" - Harriman House (July 2008)
| Address: | VIA ROBERTO AGO 26 POSTAL CODE 00166 |
| Rome, ITALY | |
| Phone # for sales: | +393357540708 |
| E-mail address: | pezzutti.paolo@tiscali.it |
Click here for more information about our publications!
Comments
Date: 02/12/08Rank: 5Comment:

Request Information From Our Sponsors
- StockCharts.com, Inc.
- Candle Patterns
- Candlestick Charting Explained
- Intermarket Technical Analysis
- John Murphy on Chart Analysis
- John Murphy's Chart Pattern Recognition
- John Murphy's Market Message
- MurphyExplainsMarketAnalysis-Intermarket Analysis
- MurphyExplainsMarketAnalysis-Visual Analysis
- StockCharts.com
- Technical Analysis of the Financial Markets
- The Visual Investor
- VectorVest, Inc.
- Executive Premier Workshop
- One-Day Options Course
- OptionsPro
- Retirement Income Workshop
- Sure-Fire Trading Systems (VectorVest, Inc.)
- Trading as a Business Workshop
- VectorVest 7 EOD
- VectorVest 7 RealTime/IntraDay
- VectorVest AutoTester
- VectorVest Educational Services
- VectorVest OnLine
- VectorVest Options Analyzer
- VectorVest ProGraphics v6.0
- VectorVest ProTrader 7
- VectorVest RealTime Derby Tool
- VectorVest Simulator
- VectorVest Variator
- VectorVest Watchdog
