HOT TOPICS LIST
- MACD
- Fibonacci
- RSI
- Gann
- ADXR
- Stochastics
- Volume
- Triangles
- Futures
- Cycles
- Volatility
- ZIGZAG
- MESA
- Retracement
- Aroon
INDICATORS LIST
LIST OF TOPICS
PRINT THIS ARTICLE
by Mike Carr, CMT
Analyst downgrades are often a signal that a stock's decline is over, but in the case of BT, this might just be the beginning of a steeper decline.
Position: Sell
Mike Carr, CMT
Mike Carr, CMT, is a member of the Market Technicians Association, and editor of the MTA's newsletter, Technically Speaking. He is also the author of "Smarter Investing in Any Economy: The Definitive Guide to Relative Strength Investing," and "Conquering the Divide: How to Use Economic Indicators to Catch Stock Market Trends."
PRINT THIS ARTICLE
REL. STR COMPARATIVE
Analysts Sometimes Get It Right — Short BT
02/08/08 10:00:07 AMby Mike Carr, CMT
Analyst downgrades are often a signal that a stock's decline is over, but in the case of BT, this might just be the beginning of a steeper decline.
Position: Sell
| British telecommunications giant BT Group (BT) reported that profits dipped by 1% in the fourth quarter because revenue growth was lower than expected. The company blamed the shortfall on an increasingly competitive broadband market. In response, the company's stock price slid almost 10% on the news. Analysts at Bear Stearns and other companies responded by downgrading the stock. |
| Analysts often issue reports after the news is reflected in the price of the stock. In this case, the stock is trading with a price/earnings ratio near 7, a very low valuation for a company with more than $40 billion in annual sales. This is the kind of stock that fundamental analysts often call "cheap" as they buy in expectation of the upturn. However, what they fail to consider is that earnings can go down, and if earnings continue to decline, the P/E ratio can go higher while the price drops. |
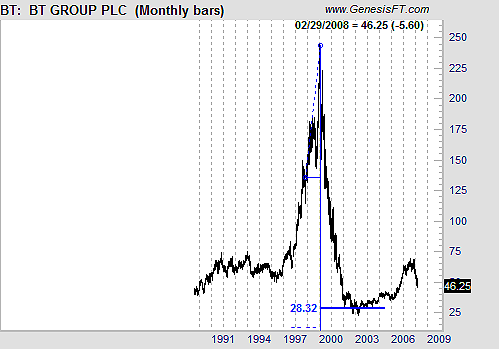
| The long-term chart of BT indicates that it is still working off the excesses reached in the Internet bubble (Figure 1). Using the final stage of that blowoff pattern to develop a price target, BT is still subject to a 20-point decline. This target coincides with the support levels reached after the initial decline. The current price level has retraced slightly more than half of the bounce from that bottom, and after failing at the Fibonacci retracement levels, it is likely to fall back to the lower support levels. |

|
| FIGURE 1: BT, LONG-TERM. Long-term charts are often useful to identify price objectives, even for short-term traders. |
| Graphic provided by: Trade Navigator. |
| |
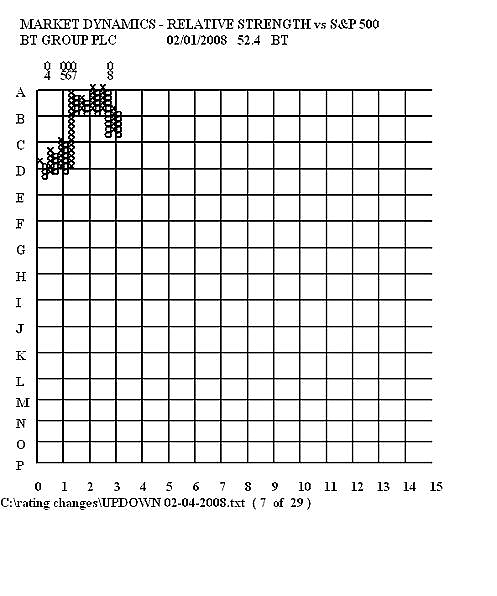
| Relative strength is also pointing to lower prices. The long-term chart of relative strength in a point & figure format shows that a major top formed over the last three years and the pattern broke out to the downside in January (Figure 2). This chart indicates that a price decline is more likely than a price rise. |

|
| FIGURE 2: BT, POINT & FIGURE. Long-term relative strength confirms the bearish pattern for BT. |
| Graphic provided by: Market Dynamics (www.clayallen.com). |
| |
| Overall, the charts say the analysts have this one right. BT is likely to fall significantly in the months ahead, but shorts need to be aware that the stock pays a significant dividend. Put options or single stock futures are a better strategy than outright short sales in dividend-paying stocks. |
Mike Carr, CMT, is a member of the Market Technicians Association, and editor of the MTA's newsletter, Technically Speaking. He is also the author of "Smarter Investing in Any Economy: The Definitive Guide to Relative Strength Investing," and "Conquering the Divide: How to Use Economic Indicators to Catch Stock Market Trends."
| Website: | www.moneynews.com/blogs/MichaelCarr/id-73 |
| E-mail address: | marketstrategist@gmail.com |
Click here for more information about our publications!
Comments
Date: 02/09/08Rank: 2Comment:

Request Information From Our Sponsors
- StockCharts.com, Inc.
- Candle Patterns
- Candlestick Charting Explained
- Intermarket Technical Analysis
- John Murphy on Chart Analysis
- John Murphy's Chart Pattern Recognition
- John Murphy's Market Message
- MurphyExplainsMarketAnalysis-Intermarket Analysis
- MurphyExplainsMarketAnalysis-Visual Analysis
- StockCharts.com
- Technical Analysis of the Financial Markets
- The Visual Investor
- VectorVest, Inc.
- Executive Premier Workshop
- One-Day Options Course
- OptionsPro
- Retirement Income Workshop
- Sure-Fire Trading Systems (VectorVest, Inc.)
- Trading as a Business Workshop
- VectorVest 7 EOD
- VectorVest 7 RealTime/IntraDay
- VectorVest AutoTester
- VectorVest Educational Services
- VectorVest OnLine
- VectorVest Options Analyzer
- VectorVest ProGraphics v6.0
- VectorVest ProTrader 7
- VectorVest RealTime Derby Tool
- VectorVest Simulator
- VectorVest Variator
- VectorVest Watchdog
