HOT TOPICS LIST
- MACD
- Fibonacci
- RSI
- Gann
- ADXR
- Stochastics
- Volume
- Triangles
- Futures
- Cycles
- Volatility
- ZIGZAG
- MESA
- Retracement
- Aroon
INDICATORS LIST
LIST OF TOPICS
PRINT THIS ARTICLE
by Arthur Hill
Alaska Air is bucking the trend of the overall market with a resistance breakout on good volume.
Position: N/A
Arthur Hill
Arthur Hill is currently editor of TDTrader.com, a website specializing in trading strategies, sector/industry specific breadth stats and overall technical analysis. He passed the Society of Technical Analysts (STA London) diploma exam with distinction is a Certified Financial Technician (CFTe). Prior to TD Trader, he was the Chief Technical Analyst for Stockcharts.com and the main contributor to the ChartSchool.
PRINT THIS ARTICLE
BREAKOUTS
Alaska Air Flies Higher
02/08/08 09:41:16 AMby Arthur Hill
Alaska Air is bucking the trend of the overall market with a resistance breakout on good volume.
Position: N/A
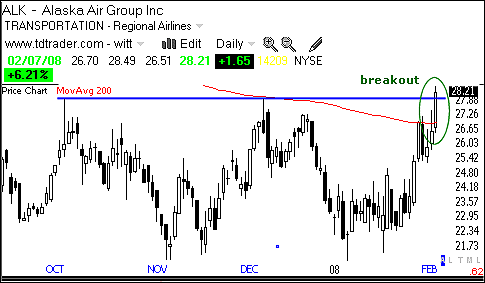
| Alaska Airline (ALK) consolidated from August 2007 to January 2008 and broke resistance with a big surge in February. The stock touched support around 21–22 at least three times and resistance around 27–28 at least twice. Overall, the pattern looks like a large rectangle and the breakout opens the door to higher prices. In addition to breaking its prior highs, the stock also broke the 200-day moving average. See Figure 1. |

|
| FIGURE 1: ALK, DAILY. Alaska Air consolidated from August 2007 to January 2008 and broke resistance with a big surge in February. |
| Graphic provided by: TeleChart2007. |
| |
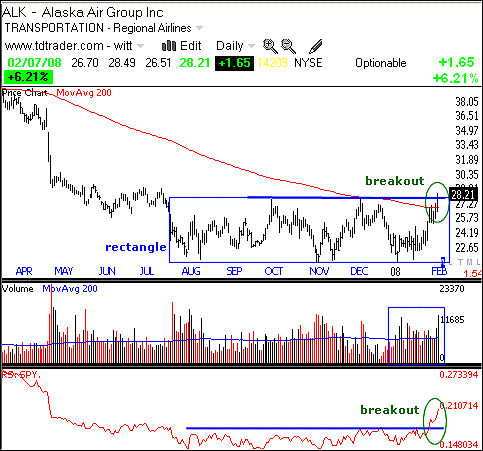
| Based on traditional technical analysis, the upside target is to around 35. The length of the rectangle can be added to the breakout for a target. The length is roughly 7 (28 - 21 = 7). A seven-point advance from the breakout would extend to 35 (28 + 7 = 35). |

|
| FIGURE 2: ALK, DAILY. Upside volume surged as the stock bounced off support in January and remained strong on the February breakout. |
| Graphic provided by: TeleChart2007. |
| |
| Volume and relative strength confirmed the breakout. Upside volume surged as the stock bounced off support in January and remained strong on the February breakout. This shows strong buying pressure and should provide fuel to continue the advance. The bottom indicator window shows ALK relative to the S&P 500 ETF (SPY). This indicator traded flat for nine months and then broke resistance with the January–February surge. ALK is once again leading the market and this is bullish. See Figure 2. |
Arthur Hill is currently editor of TDTrader.com, a website specializing in trading strategies, sector/industry specific breadth stats and overall technical analysis. He passed the Society of Technical Analysts (STA London) diploma exam with distinction is a Certified Financial Technician (CFTe). Prior to TD Trader, he was the Chief Technical Analyst for Stockcharts.com and the main contributor to the ChartSchool.
| Title: | Editor |
| Company: | TDTrader.com |
| Address: | Willem Geetsstraat 17 |
| Mechelen, B2800 | |
| Phone # for sales: | 3215345465 |
| Website: | www.tdtrader.com |
| E-mail address: | arthurh@tdtrader.com |
Traders' Resource Links | |
| TDTrader.com has not added any product or service information to TRADERS' RESOURCE. | |
Click here for more information about our publications!
Comments
Date: 02/09/08Rank: 4Comment:

|

Request Information From Our Sponsors
- StockCharts.com, Inc.
- Candle Patterns
- Candlestick Charting Explained
- Intermarket Technical Analysis
- John Murphy on Chart Analysis
- John Murphy's Chart Pattern Recognition
- John Murphy's Market Message
- MurphyExplainsMarketAnalysis-Intermarket Analysis
- MurphyExplainsMarketAnalysis-Visual Analysis
- StockCharts.com
- Technical Analysis of the Financial Markets
- The Visual Investor
- VectorVest, Inc.
- Executive Premier Workshop
- One-Day Options Course
- OptionsPro
- Retirement Income Workshop
- Sure-Fire Trading Systems (VectorVest, Inc.)
- Trading as a Business Workshop
- VectorVest 7 EOD
- VectorVest 7 RealTime/IntraDay
- VectorVest AutoTester
- VectorVest Educational Services
- VectorVest OnLine
- VectorVest Options Analyzer
- VectorVest ProGraphics v6.0
- VectorVest ProTrader 7
- VectorVest RealTime Derby Tool
- VectorVest Simulator
- VectorVest Variator
- VectorVest Watchdog
