HOT TOPICS LIST
- MACD
- Fibonacci
- RSI
- Gann
- ADXR
- Stochastics
- Volume
- Triangles
- Futures
- Cycles
- Volatility
- ZIGZAG
- MESA
- Retracement
- Aroon
INDICATORS LIST
LIST OF TOPICS
PRINT THIS ARTICLE
by Chaitali Mohile
The upside breakout would have been much more successful under healthy technical conditions. The stock is back below its historical resistance with a huge gap down, so what does that say about the trades in hand?
Position: N/A
Chaitali Mohile
Active trader in the Indian stock markets since 2003 and a full-time writer. Trading is largely based upon technical analysis.
PRINT THIS ARTICLE
VOLATILITY
The Breakout In JPM Tumbled
02/19/08 11:03:18 AMby Chaitali Mohile
The upside breakout would have been much more successful under healthy technical conditions. The stock is back below its historical resistance with a huge gap down, so what does that say about the trades in hand?
Position: N/A
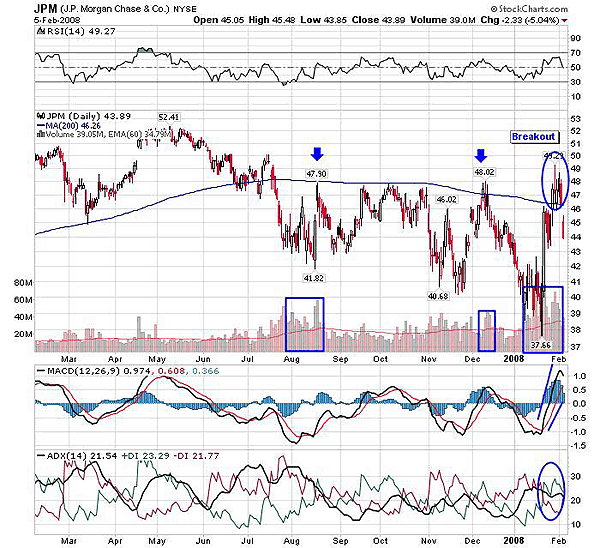
| JP Morgan Chase (JPM) slumped almost 5% and was probably one of the worst-hit stocks in the entire financial sector. The turmoil in the US financial market affected the stock, hitting it with consolidation after a much-needed breakout. The fears of recession dragged the stock below the support level of the 200-day moving average. I was watchful of this stock as the breakout was much awaited and JPM was under serious pressure. See Figure 1. |

|
| FIGURE 1: JPM, DAILY. The gap down weakened the breakout that was supported by positive notes by all three indicators. Even the volumes on breakout were encouraging. |
| Graphic provided by: StockCharts.com. |
| |
| Technically, Figure 1 was perfectly ready to carry the breakout to new highs. The volumes were swollen as price surged above the 200-day moving average resistance, stabilizing the breakout. The stock as a result was consolidating after its upward journey, gathering the required strength to uphold the volatility in the sector and resume the direction. That went even for the momentum indicator; the relative strength index (RSI)(14) was comfortably above a bullish support area of 50. |
| The moving average convergence/divergence (MACD) (12,26,9) was very much positive, sustaining in positive territory. So how can anyone anticipate that the stock would crumple hard with huge gap down? If we talk about the trend indicator, the average directional movement index (ADX) (14), then the trend too was trying to grab the bullish trend with the positive directional index (+DI) gaining over -DI. So everything was in the right place to sustain the breakout. Due to the recent gap down, the traders have been left with a surprise. |

|
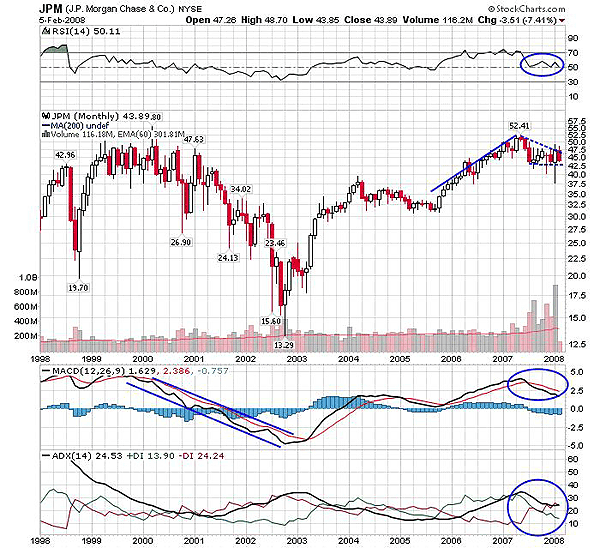
| FIGURE 2: JPM, MONTHLY. The stock has consolidated after the prolonged upside rally. With the sideways move, the lower range support is held strongly. |
| Graphic provided by: StockCharts.com. |
| |
| Figure 2, the monthly chart, shows a bullish continuation pattern of the flag & pennant pattern. The stock is holding onto its lower support level of 42.5 for the past six months or so. The ADX (14) in Figure 2 suggests consolidation, as both DIs are battling to regain the trend. The RSI (14) has established support at 50, which now stands a crucial level. The MACD (12,26,9) is in positive territory but declining. So the long-term view on JPM for investors is to stay on the sidelines till the stock gives the all-clear. |
| Turning back to the daily chart (Figure 1), the indicators are still holding their bullish position. If damage would not occur by then, I would have suggested staying long with the support of the 200-day moving average. But the stock is again below new resistance, so I would recommend staying neutral on JPM and waiting for the bulls to come back. Saving capital is important than holding a losing position. |
Active trader in the Indian stock markets since 2003 and a full-time writer. Trading is largely based upon technical analysis.
| Company: | Independent |
| Address: | C1/3 Parth Indraprasth Towers. Vastrapur |
| Ahmedabad, Guj 380015 | |
| E-mail address: | chaitalimohile@yahoo.co.in |
Traders' Resource Links | |
| Independent has not added any product or service information to TRADERS' RESOURCE. | |
Click here for more information about our publications!
Comments

Request Information From Our Sponsors
- StockCharts.com, Inc.
- Candle Patterns
- Candlestick Charting Explained
- Intermarket Technical Analysis
- John Murphy on Chart Analysis
- John Murphy's Chart Pattern Recognition
- John Murphy's Market Message
- MurphyExplainsMarketAnalysis-Intermarket Analysis
- MurphyExplainsMarketAnalysis-Visual Analysis
- StockCharts.com
- Technical Analysis of the Financial Markets
- The Visual Investor
- VectorVest, Inc.
- Executive Premier Workshop
- One-Day Options Course
- OptionsPro
- Retirement Income Workshop
- Sure-Fire Trading Systems (VectorVest, Inc.)
- Trading as a Business Workshop
- VectorVest 7 EOD
- VectorVest 7 RealTime/IntraDay
- VectorVest AutoTester
- VectorVest Educational Services
- VectorVest OnLine
- VectorVest Options Analyzer
- VectorVest ProGraphics v6.0
- VectorVest ProTrader 7
- VectorVest RealTime Derby Tool
- VectorVest Simulator
- VectorVest Variator
- VectorVest Watchdog
