

HOT TOPICS LIST
- MACD
- Fibonacci
- RSI
- Gann
- ADXR
- Stochastics
- Volume
- Triangles
- Futures
- Cycles
- Volatility
- ZIGZAG
- MESA
- Retracement
- Aroon
INDICATORS LIST
LIST OF TOPICS
PRINT THIS ARTICLE
by Arthur Hill
After bouncing back to broken support, Air Products formed a bearish harami that could signal the end of the bounce.
Position: Sell
Arthur Hill
Arthur Hill is currently editor of TDTrader.com, a website specializing in trading strategies, sector/industry specific breadth stats and overall technical analysis. He passed the Society of Technical Analysts (STA London) diploma exam with distinction is a Certified Financial Technician (CFTe). Prior to TD Trader, he was the Chief Technical Analyst for Stockcharts.com and the main contributor to the ChartSchool.
PRINT THIS ARTICLE
CANDLESTICK CHARTING
A Harami For Air Products
02/06/08 08:44:34 AMby Arthur Hill
After bouncing back to broken support, Air Products formed a bearish harami that could signal the end of the bounce.
Position: Sell
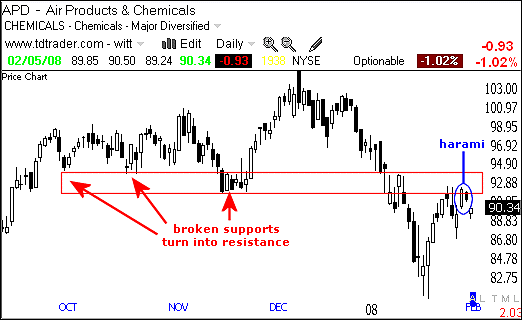
| Air Products (APD) broke support with a sharp decline in January. The move broke below the October and November lows. These broken support levels now turn into resistance. The stock rallied back to broken support and stalled over the last six days. See Figure 1. |
|
| FIGURE 1: APD, DAILY. Here, the broken support levels have turned to resistance. |
| Graphic provided by: TeleChart2007. |
| |
| With a gap and a long white candlestick, it looked like the stock might break resistance. However, the stock formed a smaller black candlestick the next day, and the two-day pattern is a harami (blue oval). This is a potentially bearish candlestick reversal pattern that requires confirmation. Another black candlestick and close below 89 would provide confirmation. A move above the harami high would negate this bearish setup. |
|
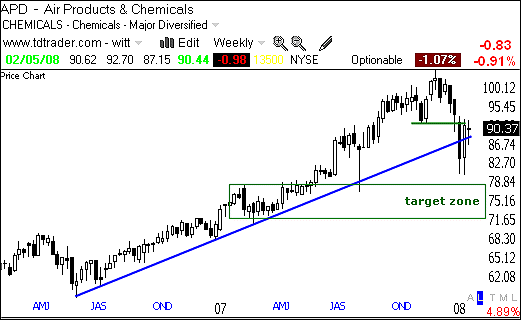
| FIGURE 2: APD, WEEKLY. The next target zone is centered around 75. A lower low makes sense here. |
| Graphic provided by: TC2000.com. |
| |
| The first and most obvious downside target is the January low around 81. The next support area is centered around 75. This is the next target and a lower low makes sense. The stock broke a long trendline with the January decline and it looks like a bigger trend change is afoot. Downtrends are all about lower lows and a move below the January low would fit with a downtrend. |
Arthur Hill is currently editor of TDTrader.com, a website specializing in trading strategies, sector/industry specific breadth stats and overall technical analysis. He passed the Society of Technical Analysts (STA London) diploma exam with distinction is a Certified Financial Technician (CFTe). Prior to TD Trader, he was the Chief Technical Analyst for Stockcharts.com and the main contributor to the ChartSchool.
| Title: | Editor |
| Company: | TDTrader.com |
| Address: | Willem Geetsstraat 17 |
| Mechelen, B2800 | |
| Phone # for sales: | 3215345465 |
| Website: | www.tdtrader.com |
| E-mail address: | arthurh@tdtrader.com |
Traders' Resource Links | |
| TDTrader.com has not added any product or service information to TRADERS' RESOURCE. | |
Click here for more information about our publications!
Comments
Date:�02/06/08Rank:�3Comment:�

Request Information From Our Sponsors
- StockCharts.com, Inc.
- Candle Patterns
- Candlestick Charting Explained
- Intermarket Technical Analysis
- John Murphy on Chart Analysis
- John Murphy's Chart Pattern Recognition
- John Murphy's Market Message
- MurphyExplainsMarketAnalysis-Intermarket Analysis
- MurphyExplainsMarketAnalysis-Visual Analysis
- StockCharts.com
- Technical Analysis of the Financial Markets
- The Visual Investor
- VectorVest, Inc.
- Executive Premier Workshop
- One-Day Options Course
- OptionsPro
- Retirement Income Workshop
- Sure-Fire Trading Systems (VectorVest, Inc.)
- Trading as a Business Workshop
- VectorVest 7 EOD
- VectorVest 7 RealTime/IntraDay
- VectorVest AutoTester
- VectorVest Educational Services
- VectorVest OnLine
- VectorVest Options Analyzer
- VectorVest ProGraphics v6.0
- VectorVest ProTrader 7
- VectorVest RealTime Derby Tool
- VectorVest Simulator
- VectorVest Variator
- VectorVest Watchdog