HOT TOPICS LIST
- MACD
- Fibonacci
- RSI
- Gann
- ADXR
- Stochastics
- Volume
- Triangles
- Futures
- Cycles
- Volatility
- ZIGZAG
- MESA
- Retracement
- Aroon
INDICATORS LIST
LIST OF TOPICS
PRINT THIS ARTICLE
by Chaitali Mohile
Taiwan iShares is tangling around the resistance area -- which direction should it move now?
Position: N/A
Chaitali Mohile
Active trader in the Indian stock markets since 2003 and a full-time writer. Trading is largely based upon technical analysis.
PRINT THIS ARTICLE
BREAKOUTS
Taiwan iShares Back At Crossroads
02/15/08 12:49:54 PMby Chaitali Mohile
Taiwan iShares is tangling around the resistance area -- which direction should it move now?
Position: N/A
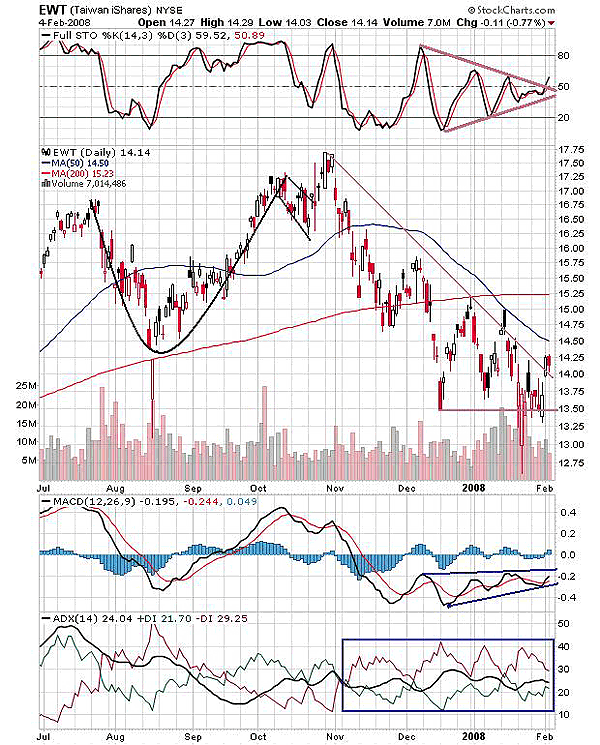
| The cup-with-handle breakout failed and the Taiwan iShares entered in significant downtrend for quite some time. The cup with handle is a continuation pattern where the uptrend pauses, trades lower, and ultimately continues in an upward direction on completion of the pattern. The breakout should have rallied the security much higher, precisely 2.5 points above the breakout level (17.25 - 14.75 = 2.5 + 17.25 = 19.75), with 19.75 the measured estimated level. The volume was not so enthusiastic to pull up the stock at target level and thus was dragged below. The breakout failed and a new downtrend was born. See Figure 1. |

|
| FIGURE 1: EWT, DAILY. The cup-with-handle breakout failed, giving a major trend reversal indication, and thereafter the EWT was engulfed by a bearish trend. The breakout going upward would be the perfect path from the crossroad. |
| Graphic provided by: StockCharts.com. |
| |
| The support of the 200-day moving average was turned off, with a gap down powering the bears. Till then, EWT had a difficult trading session with lower lows and lower highs; after a gap down within a few sessions, EWT successfully established support around 13.50 levels. With this support, EWT was thrusting a 50-day moving average resistance after bearish moving average crossover. The downward-sloping trendline and a trendline at the support area forms an ascending triangle, so now the question is whether the breakout would occur now, or if EWT would continue forming a lower high till the range is narrowed further. |
| Earlier, the two DIs (positive and negative directional index) had moved closer, with the possibility of a downtrend changed to an uptrend. But the trend indicator surprised traders, and both DIs parted, leaving the downtrend intact. Similar conditions are appearing now; both the DIs are likely to collide. If history is not repeated, then a new beginning can be expected. EWT may enter in a new uptrend, with the other two indicators, the moving average convergence/divergence (MACD) (12,26,9) and the stochastic (14,3,3), showing some bullish bias. |
| Earlier, the MACD (12,26,9) was highly negative with large volatility that increased bearish pressure on the stock. And the stochastic (14,3,3) found it difficult to sustain above the 50 level, with eventually the lower high and higher low forming a symmetrical triangle. The stochastic movement is narrowed and indicates almost a breakout above the upper trendline. So this again extends positive notes bringing in buying pressure. The stock is likely to be at a crossroad, deciding whether to be in a new uptrend or to remain under bearish control. |
Active trader in the Indian stock markets since 2003 and a full-time writer. Trading is largely based upon technical analysis.
| Company: | Independent |
| Address: | C1/3 Parth Indraprasth Towers. Vastrapur |
| Ahmedabad, Guj 380015 | |
| E-mail address: | chaitalimohile@yahoo.co.in |
Traders' Resource Links | |
| Independent has not added any product or service information to TRADERS' RESOURCE. | |
Click here for more information about our publications!
Comments
Date: 02/18/08Rank: 4Comment:

Request Information From Our Sponsors
- StockCharts.com, Inc.
- Candle Patterns
- Candlestick Charting Explained
- Intermarket Technical Analysis
- John Murphy on Chart Analysis
- John Murphy's Chart Pattern Recognition
- John Murphy's Market Message
- MurphyExplainsMarketAnalysis-Intermarket Analysis
- MurphyExplainsMarketAnalysis-Visual Analysis
- StockCharts.com
- Technical Analysis of the Financial Markets
- The Visual Investor
- VectorVest, Inc.
- Executive Premier Workshop
- One-Day Options Course
- OptionsPro
- Retirement Income Workshop
- Sure-Fire Trading Systems (VectorVest, Inc.)
- Trading as a Business Workshop
- VectorVest 7 EOD
- VectorVest 7 RealTime/IntraDay
- VectorVest AutoTester
- VectorVest Educational Services
- VectorVest OnLine
- VectorVest Options Analyzer
- VectorVest ProGraphics v6.0
- VectorVest ProTrader 7
- VectorVest RealTime Derby Tool
- VectorVest Simulator
- VectorVest Variator
- VectorVest Watchdog
