HOT TOPICS LIST
- MACD
- Fibonacci
- RSI
- Gann
- ADXR
- Stochastics
- Volume
- Triangles
- Futures
- Cycles
- Volatility
- ZIGZAG
- MESA
- Retracement
- Aroon
INDICATORS LIST
LIST OF TOPICS
PRINT THIS ARTICLE
by Chaitali Mohile
The correction phase of the semiconductor index may be coming to an end and a trend reversal may soon be in place.
Position: Buy
Chaitali Mohile
Active trader in the Indian stock markets since 2003 and a full-time writer. Trading is largely based upon technical analysis.
PRINT THIS ARTICLE
ROUND TOP & BOTTOM
Good Days For Semiconductor Index
02/12/08 09:41:55 AMby Chaitali Mohile
The correction phase of the semiconductor index may be coming to an end and a trend reversal may soon be in place.
Position: Buy
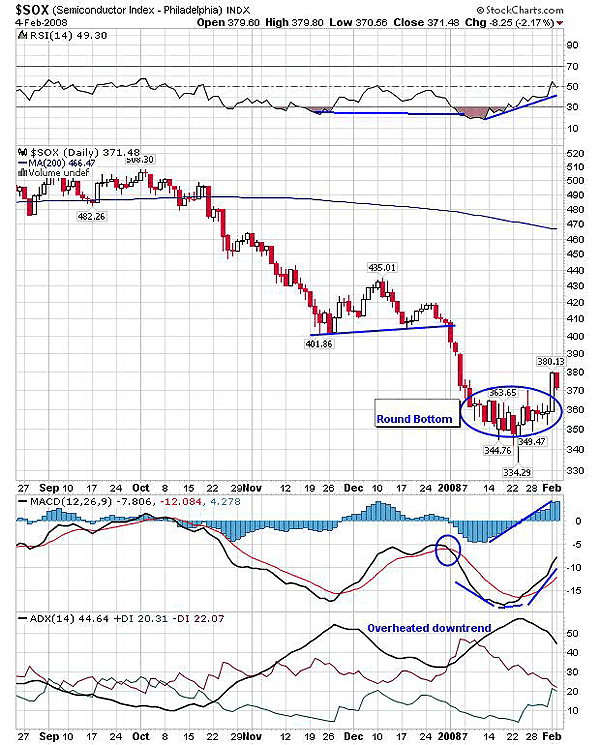
| The semiconductor index seems to be bottoming and therefore the end to the corrective phase of index may be at hand, perhaps initiating a fresh uptrend. A rounding bottom pattern is formed, which strengthens the possibility of an upcoming bullish power. A rounding pattern is a bullish reversal pattern indicating a bottom formation and usually occurs after a long declining rally. The index has actually broken out and could pull up to higher levels, up to 410, though volatility persists. There is a strong possibility of a profit-taking rally at every new level during a pullback, reconfirming the lessening confidence in traders. The average directional movement index (ADX) (14) and (-DI) negative directional index both are declining but both the DIs are converging. The buying pressure is increasing, which might roll above selling pressure, gradually winning the trend. See Figure 1. |

|
| FIGURE 1: $SOX, DAILY. The round bottom formed, indicating a fresh upward rally in the next few days. The ADX (14) shows an overheated downtrend that is declining, so a new uptrend will begin soon. |
| Graphic provided by: StockCharts.com. |
| |
| The bullish reversal pattern has support from developing buying pressure. In addition, the moving average convergence/divergence (MACD) also has formed a rounded bottom in deep negative territory. With a bullish crossover the indicator is ready to zoom above the zero line. The positive clues can be seen on the MACD (12,26,9) and can add value to the breakout. The relative srength index (RSI) (14) remained oversold for almost a week, with a higher low when the index was at its support level. This suggests that the index was closer to bottom, and eventually, $SOX formed a rounding bottom and started moving up. The RSI (14) moved steeply above 30, boosting the bullish rally. The momentum oscillator is closer to the golden 50 level, so establishing support here would bring stability to the rally ahead. |
| All the three indicators are tuning to bullish frequency, so the breakout could see a healthy upside rally ahead. The profit booking session is possible due to the volatility and mixed views from other financial markets across the world. The index may also consolidate during its upward journey so buying the semiconductors' stock level currently would be a low and risky entry, according to the breakout in $SOX. |
Active trader in the Indian stock markets since 2003 and a full-time writer. Trading is largely based upon technical analysis.
| Company: | Independent |
| Address: | C1/3 Parth Indraprasth Towers. Vastrapur |
| Ahmedabad, Guj 380015 | |
| E-mail address: | chaitalimohile@yahoo.co.in |
Traders' Resource Links | |
| Independent has not added any product or service information to TRADERS' RESOURCE. | |
Click here for more information about our publications!
Comments
Date: 02/12/08Rank: 4Comment:

Request Information From Our Sponsors
- StockCharts.com, Inc.
- Candle Patterns
- Candlestick Charting Explained
- Intermarket Technical Analysis
- John Murphy on Chart Analysis
- John Murphy's Chart Pattern Recognition
- John Murphy's Market Message
- MurphyExplainsMarketAnalysis-Intermarket Analysis
- MurphyExplainsMarketAnalysis-Visual Analysis
- StockCharts.com
- Technical Analysis of the Financial Markets
- The Visual Investor
- VectorVest, Inc.
- Executive Premier Workshop
- One-Day Options Course
- OptionsPro
- Retirement Income Workshop
- Sure-Fire Trading Systems (VectorVest, Inc.)
- Trading as a Business Workshop
- VectorVest 7 EOD
- VectorVest 7 RealTime/IntraDay
- VectorVest AutoTester
- VectorVest Educational Services
- VectorVest OnLine
- VectorVest Options Analyzer
- VectorVest ProGraphics v6.0
- VectorVest ProTrader 7
- VectorVest RealTime Derby Tool
- VectorVest Simulator
- VectorVest Variator
- VectorVest Watchdog
