HOT TOPICS LIST
- MACD
- Fibonacci
- RSI
- Gann
- ADXR
- Stochastics
- Volume
- Triangles
- Futures
- Cycles
- Volatility
- ZIGZAG
- MESA
- Retracement
- Aroon
INDICATORS LIST
LIST OF TOPICS
PRINT THIS ARTICLE
by Chaitali Mohile
Clear Channel has moved below the potential support and the stock may melt down further due to weak indicators.
Position: Sell
Chaitali Mohile
Active trader in the Indian stock markets since 2003 and a full-time writer. Trading is largely based upon technical analysis.
PRINT THIS ARTICLE
SUPPORT & RESISTANCE
Clear Channel Weakens Further
02/11/08 02:25:04 PMby Chaitali Mohile
Clear Channel has moved below the potential support and the stock may melt down further due to weak indicators.
Position: Sell
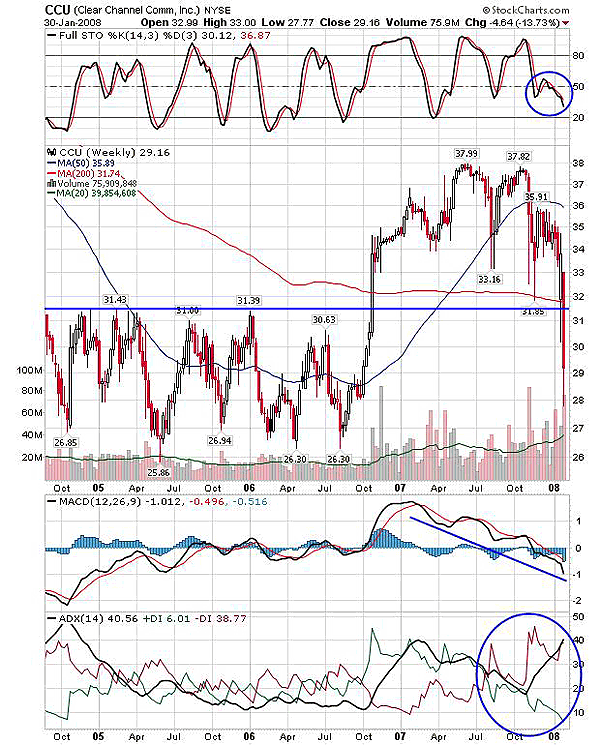
| Figure 1 shows the large volatility at each phase during its journey. The stock was stuck in a wide range for almost two and half years. The five-point range (31-27) was traded on comparatively lower volume due to high volatility. The volume expanded as the stock broke off from upper resistance of 31 and the 200-day moving average resistance as well. The breakout brought back the bullish strength that drove fresh long positions to good profits till the 37 level. The moving average convergence/divergence (MACD) (12,26,9) moved above the zero line, leaving behind the numerous zigzag moves. But the rally was accompanied by volatility, as can be seen by the indecision of the MACD histogram to sustain above the zero line. |

|
| FIGURE 1: CCU, WEEKLY. All three indicators are highly bearish to pull down the stock to prior lows of 26&ndash27. |
| Graphic provided by: StockCharts.com. |
| |
| Under similar pressure, the stochastic (14,3,3) formed a double top in a bearish reversal pattern and so did the price. In addition, the MACD (12,26,9) failed to move higher in positive territory and slipped below the trigger line gradually, with a steep fall. The 200-day MA support was under threat as bears were back and also potential support (previous resistance turned support) was cracked as indicators turned bearish. The stochastic (14,3,3) has moved closer to 20. As mentioned earlier, the MACD (12,26,9) has turned bearish and finally, the trend indicator is pointing to a well-developed downtrend. Therefore, on these bearish notes, the stock has witnessed some more selling pressure and lower levels; the 27-26 range is likely to get tested. |

|
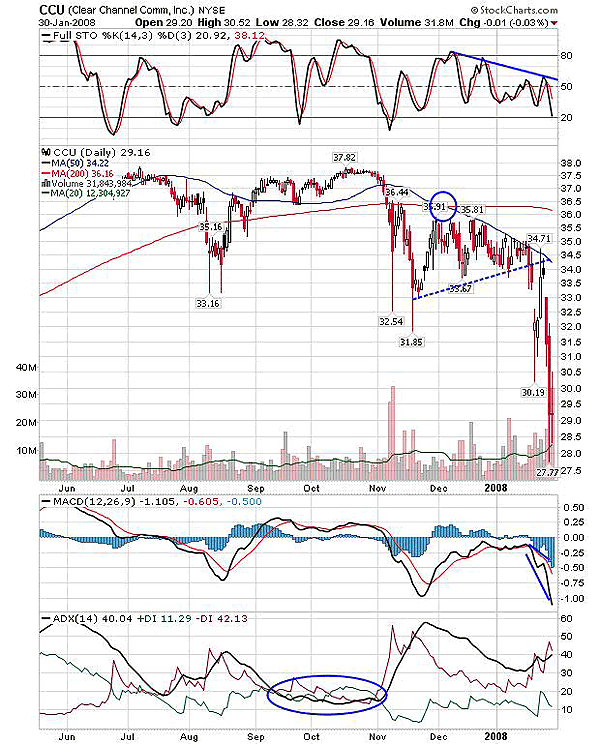
| FIGURE 2: CCU, DAILY. The marked circle on ADX (14) shows the battle between bulls and bears that was conquered by bears and the downtrend was developed. On the bearish notes, the symmetrical triangle broke down. |
| Graphic provided by: StockCharts.com. |
| |
| Figure 2 shows an intraday picture of weakness and the possibility of a short trade. The bearish moving average crossover was the first reversal signal leading to distraction in an upward rally. The 50-day moving average sloped down, resisting bulls and forming lower highs and the buying pressure, with every dip failing to surge. This entire movement formed a symmetrical triangle that obviously had to break down due to the implied bearish stress on the stock. With the breakdown, the indicators suggested more bears thrusting in, weakening the stock further. The average directional movement index (ADX) (14) shows a well-developed downtrend and the positive directional index (+DI) / negative directional index (-DI) are poles apart. This signifies selling pressure would lead the rally ahead. |
| If you already have a short position open you can hold it with a target of 26. You can open a trade at this point, in the same direction, with a stop-loss of 31. |
Active trader in the Indian stock markets since 2003 and a full-time writer. Trading is largely based upon technical analysis.
| Company: | Independent |
| Address: | C1/3 Parth Indraprasth Towers. Vastrapur |
| Ahmedabad, Guj 380015 | |
| E-mail address: | chaitalimohile@yahoo.co.in |
Traders' Resource Links | |
| Independent has not added any product or service information to TRADERS' RESOURCE. | |
Click here for more information about our publications!
Comments
Date: 02/12/08Rank: 2Comment:

Request Information From Our Sponsors
- StockCharts.com, Inc.
- Candle Patterns
- Candlestick Charting Explained
- Intermarket Technical Analysis
- John Murphy on Chart Analysis
- John Murphy's Chart Pattern Recognition
- John Murphy's Market Message
- MurphyExplainsMarketAnalysis-Intermarket Analysis
- MurphyExplainsMarketAnalysis-Visual Analysis
- StockCharts.com
- Technical Analysis of the Financial Markets
- The Visual Investor
- VectorVest, Inc.
- Executive Premier Workshop
- One-Day Options Course
- OptionsPro
- Retirement Income Workshop
- Sure-Fire Trading Systems (VectorVest, Inc.)
- Trading as a Business Workshop
- VectorVest 7 EOD
- VectorVest 7 RealTime/IntraDay
- VectorVest AutoTester
- VectorVest Educational Services
- VectorVest OnLine
- VectorVest Options Analyzer
- VectorVest ProGraphics v6.0
- VectorVest ProTrader 7
- VectorVest RealTime Derby Tool
- VectorVest Simulator
- VectorVest Variator
- VectorVest Watchdog
