HOT TOPICS LIST
- MACD
- Fibonacci
- RSI
- Gann
- ADXR
- Stochastics
- Volume
- Triangles
- Futures
- Cycles
- Volatility
- ZIGZAG
- MESA
- Retracement
- Aroon
INDICATORS LIST
LIST OF TOPICS
PRINT THIS ARTICLE
by Chaitali Mohile
Does price follow indicator or vice versa? How long can an indicator stay at extreme levels and how do stocks react?
Position: N/A
Chaitali Mohile
Active trader in the Indian stock markets since 2003 and a full-time writer. Trading is largely based upon technical analysis.
PRINT THIS ARTICLE
RSI
Interpreting Stock/Index movement With RSI
02/08/08 12:00:09 PMby Chaitali Mohile
Does price follow indicator or vice versa? How long can an indicator stay at extreme levels and how do stocks react?
Position: N/A
| The relative strength index (RSI) is a classic indicator yet modern, followed by many experts to measure the force/strength in momentum to anchor the trade. The oscillator above 60 levels is considered overbought and can stretch to the level of 90-95, depending upon market conditions and other aspects. The trend reverse signal appears once the indicator starts declining from the overbought area and is confirmed as the bullish level of 60 is crossed. On the other hand, levels of 20 and below are oversold areas that reflect the bearish mood of the stock/index. In Figures 1 and 2, the different levels of RSI and their effects on price movements are highlighted. |
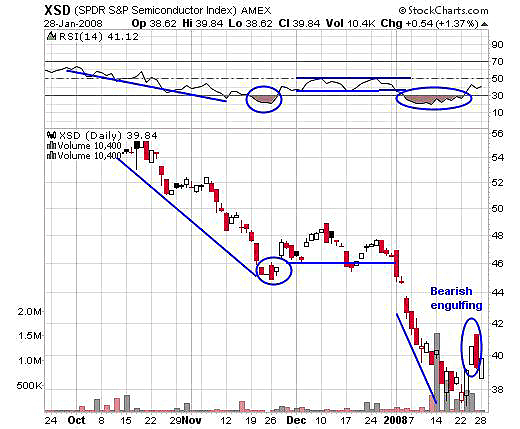
| The RSI in Figure 1 shows the descending move, the oversold levels, and the range-bound period of the S&P Semiconductor Index. The RSI has never crossed overbought levels above 70 (see Figure 1), and the trade reversal signal therefore is confirmed as the oscillator moved below the 50 level gradually. The declining move of the RSI from 70 to a marginally oversold area dragged the index from the mid-50 levels to 46. The indicator recovered from lows and stayed within the 30-50 level. You can anticipate the index to be range-bound till the oscillator indicates price will move in one particular direction. |

|
| FIGURE 1: XSD, DAILY. The declining RSI resulted in a decline in the index. The indicator was oversold twice for a shorter period, indicating some pullback. |
| Graphic provided by: StockCharts.com. |
| |
| The indicator slipped below 30 and confirmed further weakness. The index plunged further on weaker notes and hit a low of 38. If you look at the indicator you can see that the indicator hovers in the oversold area for a long time. So we can anticipate some pullback. Notice that the index rallied from 38 to 42 with a small gap up. If you trade using the RSI as a momentum indicator, you would only open a long long position when the indicator is above the 50 level. If you look at the price chart you can see the formation of a bearish engulfing pattern that indicates a reversal in an upside rally. This suggests that bears are still hovering around the index and no fresh buying nor shorting can be done unless the 50 golden level is violated or the indicator slips below 30. |

|
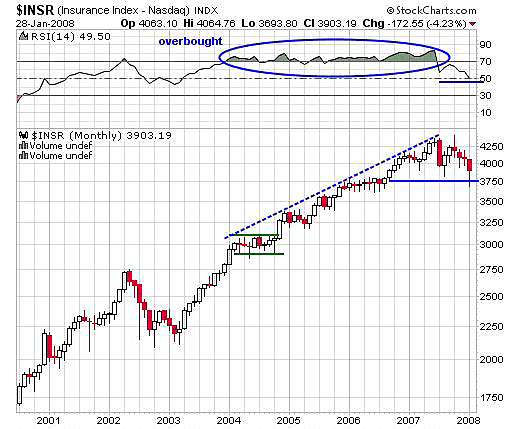
| FIGURE 2: $INSR, MONTHLY. The insurance index rallied to new highs on the highly overbought RSI. The momentum indicator was at an extreme level for almost three years. |
| Graphic provided by: StockCharts.com. |
| |
| Figure 2 explains to what extent the RSI can remain overbought and maintain the bullish pressure to pull the rally to new highs. The indicator has been overbought for almost three years, during which time the index was in an uptrend rallying to new highs. In mid-2007, the overbought RSI slipped below 70 but stayed above the 50 level. At the same time the index lost approximately 250 points (4250-4000) in a month, but maintained the support at 4000 level, turning volatile within the range. |
| As long as the indicator remains above the 50 level, there is a strong chance the index will remain bullish maintaining its support level of 3750 (see Figure 2). Therefore, the relative strength index can help forecast the direction of price movement. |
Active trader in the Indian stock markets since 2003 and a full-time writer. Trading is largely based upon technical analysis.
| Company: | Independent |
| Address: | C1/3 Parth Indraprasth Towers. Vastrapur |
| Ahmedabad, Guj 380015 | |
| E-mail address: | chaitalimohile@yahoo.co.in |
Traders' Resource Links | |
| Independent has not added any product or service information to TRADERS' RESOURCE. | |
Click here for more information about our publications!
Comments
Date: 02/09/08Rank: 5Comment:
Date: 02/12/08Rank: 4Comment:

Request Information From Our Sponsors
- StockCharts.com, Inc.
- Candle Patterns
- Candlestick Charting Explained
- Intermarket Technical Analysis
- John Murphy on Chart Analysis
- John Murphy's Chart Pattern Recognition
- John Murphy's Market Message
- MurphyExplainsMarketAnalysis-Intermarket Analysis
- MurphyExplainsMarketAnalysis-Visual Analysis
- StockCharts.com
- Technical Analysis of the Financial Markets
- The Visual Investor
- VectorVest, Inc.
- Executive Premier Workshop
- One-Day Options Course
- OptionsPro
- Retirement Income Workshop
- Sure-Fire Trading Systems (VectorVest, Inc.)
- Trading as a Business Workshop
- VectorVest 7 EOD
- VectorVest 7 RealTime/IntraDay
- VectorVest AutoTester
- VectorVest Educational Services
- VectorVest OnLine
- VectorVest Options Analyzer
- VectorVest ProGraphics v6.0
- VectorVest ProTrader 7
- VectorVest RealTime Derby Tool
- VectorVest Simulator
- VectorVest Variator
- VectorVest Watchdog
