

HOT TOPICS LIST
- MACD
- Fibonacci
- RSI
- Gann
- ADXR
- Stochastics
- Volume
- Triangles
- Futures
- Cycles
- Volatility
- ZIGZAG
- MESA
- Retracement
- Aroon
INDICATORS LIST
LIST OF TOPICS
PRINT THIS ARTICLE
by Gary Grosschadl
The airline index plunged 50% in the past year. Now there are signs of a bottom.
Position: Buy
Gary Grosschadl
Independent Canadian equities trader and technical analyst based in Peterborough
Ontario, Canada.
PRINT THIS ARTICLE
REVERSAL
Is The Airline Index Ready For Takeoff?
01/31/08 08:49:16 AMby Gary Grosschadl
The airline index plunged 50% in the past year. Now there are signs of a bottom.
Position: Buy
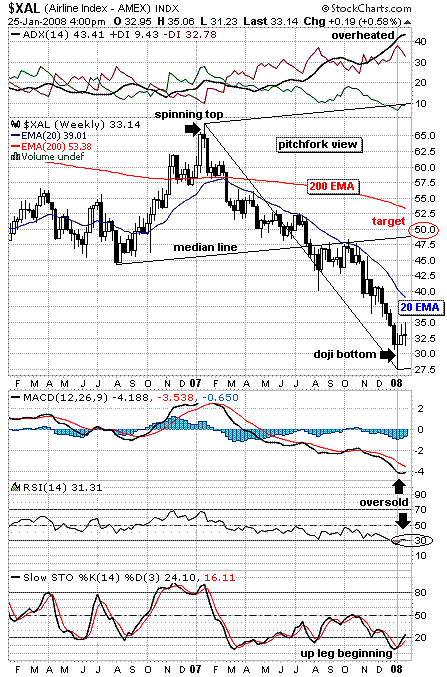
| In the last quarter of 2006, things were looking up as the airline index ($XAL) rose above its 200-period moving average. This rise hit major turbulence at 65 as a warning candlestick appeared via a spinning top. This small-bodied candlestick often seen at market tops hints at a shift in momentum by way of market hesitation. When the bulls weaken after a rise, the bears like to assert themselves. And so they did in this case, with a 50% loss. When the index moved back under its 200-period moving average, smart traders ran for the hills. See Figure 1. |
| Note how the index's 20-period moving average kept a firm lid on any attempt to rise beyond several weak bear rallies. Thus, the first challenge for this index is to rise above this "boss" resistance, currently at 39. |
|
| FIGURE 1: $XAL, WEEKLY. The airline index looks like it may try to bounce on this weekly chart. Boarding passes for intrepid traders only! |
| Graphic provided by: StockCharts.com. |
| |
| A bottom is a possibility for several reasons. The doji candlestick (long-legged doji in this case) often marks market turning points at tops and bottoms. Several indicators lend credence to this assertion. At the top of the chart, the average directional movement index (ADX) line is considered overheated, being above 40 and both DIs (directional indicators). This hints at a coming shift to bullish power. Below the chart, we see deeply oversold conditions in the moving average convergence/divergence (MACD) and the relative strength index (RSI). Meanwhile, the stochastic oscillator shows early signs of an up leg developing as it rises above its 20 level. |
| To determine an upside target, an Andrews pitchfork is plotted using three turning points on the chart (low, high, low marks). The charting software then plots lines of support and resistance. Pitchfork theory has a move to the center median line as a likely event. As long as the lower median line holds support, this upward pointing pitchfork remains bullish in this pitchfork view. The target then is roughly 50. Note the previous congestion area between around 47, as this could also be a factor. In addition, note the falling overhead 200-period exponential moving average (EMA). This also needs to be taken into consideration. Chances are this ever-important moving average line will be very close to the median line by the time the index rises further. This likely makes this area very formidable resistance. |
| In summary, a bounce is expected here but will be likely halted by a confluence of resistance offered by the pitchfork median line, the 200-day EMA, and a previous congestion near 47. But first, should takeoff be aborted by current resistance at the 20-day EMA, then all bullish bets are off and it's back to the hangar. |
Independent Canadian equities trader and technical analyst based in Peterborough
Ontario, Canada.
| Website: | www.whatsonsale.ca/financial.html |
| E-mail address: | gwg7@sympatico.ca |
Click here for more information about our publications!
Comments

Request Information From Our Sponsors
- StockCharts.com, Inc.
- Candle Patterns
- Candlestick Charting Explained
- Intermarket Technical Analysis
- John Murphy on Chart Analysis
- John Murphy's Chart Pattern Recognition
- John Murphy's Market Message
- MurphyExplainsMarketAnalysis-Intermarket Analysis
- MurphyExplainsMarketAnalysis-Visual Analysis
- StockCharts.com
- Technical Analysis of the Financial Markets
- The Visual Investor
- VectorVest, Inc.
- Executive Premier Workshop
- One-Day Options Course
- OptionsPro
- Retirement Income Workshop
- Sure-Fire Trading Systems (VectorVest, Inc.)
- Trading as a Business Workshop
- VectorVest 7 EOD
- VectorVest 7 RealTime/IntraDay
- VectorVest AutoTester
- VectorVest Educational Services
- VectorVest OnLine
- VectorVest Options Analyzer
- VectorVest ProGraphics v6.0
- VectorVest ProTrader 7
- VectorVest RealTime Derby Tool
- VectorVest Simulator
- VectorVest Variator
- VectorVest Watchdog