HOT TOPICS LIST
- MACD
- Fibonacci
- RSI
- Gann
- ADXR
- Stochastics
- Volume
- Triangles
- Futures
- Cycles
- Volatility
- ZIGZAG
- MESA
- Retracement
- Aroon
INDICATORS LIST
LIST OF TOPICS
PRINT THIS ARTICLE
by Gary Grosschadl
This former high-flier comes down 30 points for a buying opportunity.
Position: Buy
Gary Grosschadl
Independent Canadian equities trader and technical analyst based in Peterborough
Ontario, Canada.
PRINT THIS ARTICLE
DOUBLE TOPS
The Boeing Bounce
02/01/08 11:31:24 AMby Gary Grosschadl
This former high-flier comes down 30 points for a buying opportunity.
Position: Buy
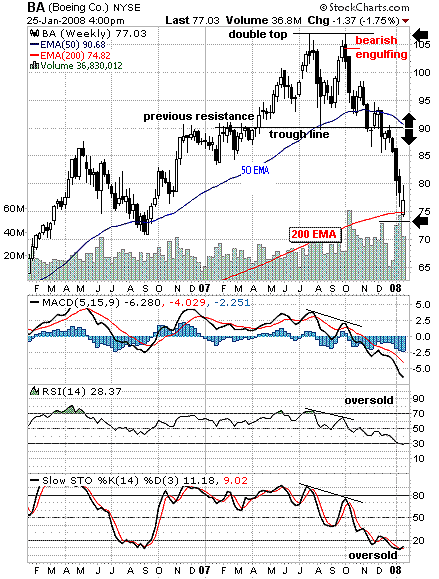
| Several big-name stocks are emulating the Dow Jones Industrial Average on their weekly charts. My last article showed the Dow weekly completing a topping pattern by way of a head & shoulders formation. The proposed bounce occurring very near the 200-period exponential moving average (EMA). Here we see a similar occurrence via a double-top pattern coming down to very near its completion target of 73 (the distance from the peak to trendline as applied to the move below the same line) and its 200-period EMA. |
| There was an excellent warning signal at the second peak above 105. Note the bearish engulfing candlestick pattern. After a strong rise especially to a peak move, a bearish engulfing formation is often a sign that the party is over. To add credence to this, observe the multiple negative divergences on the indicators below Figure 1. When a peak move comes and indicators such as the moving average convergence/divergence (MACD) and the relative strength index (RSI) fail to confirm, then downside action most likely follows. |

|
| FIGURE 1: BOEING, WEEKLY. Boeing's weekly chart shows a correction to its 200-day EMA. |
| Graphic provided by: StockCharts.com. |
| |
| What are the upside implications? The obvious target in my view is the trendline at 90. This is likely strong resistance, especially as the 50-period EMA also resides there (for now, anyway). Should enough bullish power prevail at that point, then a move to retest the double top is possible. |
| The other possibility is a failure move to the trendline or more likely the 50-period EMA, as by then it will be under 90. The safer move for many shorter-term traders will be to bail at the upside move to the 50-period EMA. If enough traders anticipate such a move, then it becomes a self-fulfilling prophecy. Is this what happened at the 200-day EMA setting up the bounce? |
Independent Canadian equities trader and technical analyst based in Peterborough
Ontario, Canada.
| Website: | www.whatsonsale.ca/financial.html |
| E-mail address: | gwg7@sympatico.ca |
Click here for more information about our publications!
Comments
Date: 02/06/08Rank: 4Comment:

Request Information From Our Sponsors
- StockCharts.com, Inc.
- Candle Patterns
- Candlestick Charting Explained
- Intermarket Technical Analysis
- John Murphy on Chart Analysis
- John Murphy's Chart Pattern Recognition
- John Murphy's Market Message
- MurphyExplainsMarketAnalysis-Intermarket Analysis
- MurphyExplainsMarketAnalysis-Visual Analysis
- StockCharts.com
- Technical Analysis of the Financial Markets
- The Visual Investor
- VectorVest, Inc.
- Executive Premier Workshop
- One-Day Options Course
- OptionsPro
- Retirement Income Workshop
- Sure-Fire Trading Systems (VectorVest, Inc.)
- Trading as a Business Workshop
- VectorVest 7 EOD
- VectorVest 7 RealTime/IntraDay
- VectorVest AutoTester
- VectorVest Educational Services
- VectorVest OnLine
- VectorVest Options Analyzer
- VectorVest ProGraphics v6.0
- VectorVest ProTrader 7
- VectorVest RealTime Derby Tool
- VectorVest Simulator
- VectorVest Variator
- VectorVest Watchdog
