HOT TOPICS LIST
- MACD
- Fibonacci
- RSI
- Gann
- ADXR
- Stochastics
- Volume
- Triangles
- Futures
- Cycles
- Volatility
- ZIGZAG
- MESA
- Retracement
- Aroon
INDICATORS LIST
LIST OF TOPICS
PRINT THIS ARTICLE
by Arthur Hill
The German DAX Index held out longer than most, but finally succumbed to the bear with a breakdown and major trend reversal.
Position: Sell
Arthur Hill
Arthur Hill is currently editor of TDTrader.com, a website specializing in trading strategies, sector/industry specific breadth stats and overall technical analysis. He passed the Society of Technical Analysts (STA London) diploma exam with distinction is a Certified Financial Technician (CFTe). Prior to TD Trader, he was the Chief Technical Analyst for Stockcharts.com and the main contributor to the ChartSchool.
PRINT THIS ARTICLE
GAPS
A Major Breakdown For The DAX
01/31/08 08:30:00 AMby Arthur Hill
The German DAX Index held out longer than most, but finally succumbed to the bear with a breakdown and major trend reversal.
Position: Sell
| Figure 1 shows monthly bars for the DAX and the last 12 years of trading. The index peaked in March 2000, bottomed in March 2003, and peaked again in July 2007. The advance to the 2007 high recouped the entire loss and met resistance from the 2000 high. This is a mighty resistance level for the index. |

|
| FIGURE 1: DAX, MONTHLY. The index peaked in March 2000, bottomed in March 2003, and peaked again in July 2007. |
| Graphic provided by: TeleChart2007. |
| |
| The blue trendline extends up from the August 2004 lows and has been touched at least three times. It takes two points to draw a trendline and one more to validate it. With the decline over the past week, the index broke this trendline and a big trend change is afoot. |
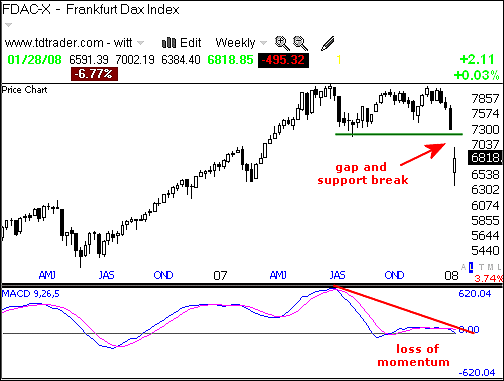
| Figure 2 shows weekly candlesticks. The index hit resistance in July 2007 and then consolidated for the next six months (July to January). The DAX held this consolidation while other stock markets fell apart but could not take it any longer last week and broke support with a big gap. This breakdown reverses a long uptrend and starts a new downtrend. |

|
| FIGURE 2: DAX, WEEKLY. Here, the index hit resistance in July 2007, then consolidated for the next six months (July to January). |
| Graphic provided by: TeleChart2007. |
| |
| Momentum confirms the breakdown. The moving average convergence/divergence (MACD) turned flat from October to January and the indicator is on the verge of turning negative. The MACD peaked in July when the index was strong. As trading turned flat in the index, the MACD moved back to the zero line and moved sideways. There was no upside momentum so the MACD hovered around the zero line. A move into negative territory and below prior low would turn momentum bearish and likely coincide with another drop in the index. |
Arthur Hill is currently editor of TDTrader.com, a website specializing in trading strategies, sector/industry specific breadth stats and overall technical analysis. He passed the Society of Technical Analysts (STA London) diploma exam with distinction is a Certified Financial Technician (CFTe). Prior to TD Trader, he was the Chief Technical Analyst for Stockcharts.com and the main contributor to the ChartSchool.
| Title: | Editor |
| Company: | TDTrader.com |
| Address: | Willem Geetsstraat 17 |
| Mechelen, B2800 | |
| Phone # for sales: | 3215345465 |
| Website: | www.tdtrader.com |
| E-mail address: | arthurh@tdtrader.com |
Traders' Resource Links | |
| TDTrader.com has not added any product or service information to TRADERS' RESOURCE. | |
Click here for more information about our publications!
PRINT THIS ARTICLE

Request Information From Our Sponsors
- StockCharts.com, Inc.
- Candle Patterns
- Candlestick Charting Explained
- Intermarket Technical Analysis
- John Murphy on Chart Analysis
- John Murphy's Chart Pattern Recognition
- John Murphy's Market Message
- MurphyExplainsMarketAnalysis-Intermarket Analysis
- MurphyExplainsMarketAnalysis-Visual Analysis
- StockCharts.com
- Technical Analysis of the Financial Markets
- The Visual Investor
- VectorVest, Inc.
- Executive Premier Workshop
- One-Day Options Course
- OptionsPro
- Retirement Income Workshop
- Sure-Fire Trading Systems (VectorVest, Inc.)
- Trading as a Business Workshop
- VectorVest 7 EOD
- VectorVest 7 RealTime/IntraDay
- VectorVest AutoTester
- VectorVest Educational Services
- VectorVest OnLine
- VectorVest Options Analyzer
- VectorVest ProGraphics v6.0
- VectorVest ProTrader 7
- VectorVest RealTime Derby Tool
- VectorVest Simulator
- VectorVest Variator
- VectorVest Watchdog
