HOT TOPICS LIST
- MACD
- Fibonacci
- RSI
- Gann
- ADXR
- Stochastics
- Volume
- Triangles
- Futures
- Cycles
- Volatility
- ZIGZAG
- MESA
- Retracement
- Aroon
INDICATORS LIST
LIST OF TOPICS
PRINT THIS ARTICLE
by Dennis D. Peterson
Bollinger bands are one of the most successful indicators available today.
Position: N/A
Dennis D. Peterson
Market index trading on a daily basis.
PRINT THIS ARTICLE
BOLLINGER BANDS
Bollinger Bands (Part III of IV)
03/21/01 10:39:18 AMby Dennis D. Peterson
Bollinger bands are one of the most successful indicators available today.
Position: N/A
| In Part II of this series, I showed that Bollinger bands did well when used with America Online [AOL] during both up and down periods. This suggests that Bollinger bands should do better than RSI only if we were to pick a stock that has gone down lately. |
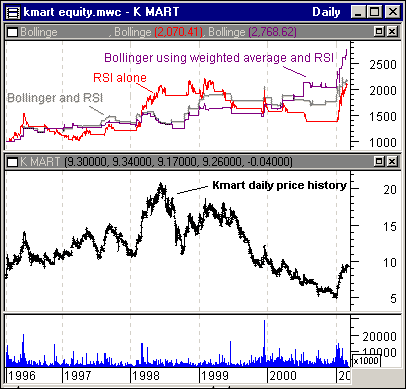
| Kmart is a good example. In 1996 it was trading at about $7.5/share and is now trading at $9.5/share. It got as high as $20/share in mid-1998. A buy-and-hold strategy would have returned 9.5/7.5 x $1,000 = $1,267 with an investment of $1,000 in 1996-not a whole lot, but certainly better than a loss. |

|
| Figure 1: Top chart: Equity growth of $1,000 using RSI, Bollinger bands and RSI, and Bollinger bands using weighted averages. Middle and lower charts: Kmart price and volume. |
| Graphic provided by: MetaStock. |
| Graphic provided by: Data vendor: eSignal<. |
| |
| I am using the same systems that were built for Part II of this series and I have added an additional one. One of the variables I mentioned was using closing price versus something else. Bollinger (see Stocks and Commodities article "Using Bollinger Bands" by John Bollinger, February 1992) mentions using a weighted close. A weighted close would be (close + close + high + low)/4, in place of using close in the Bollinger band computations. A weighted close does two things: (1) it is a more accurate average price, and (2) it is an average price weighted for closing. Average price can be advantageous because it takes out the price changes due to bull versus bear trading games. On a daily basis, if traders sense that a stock or index is overbought they might try and gun up the price at the opening of the next day to entice some buying, because their true intent is to sell a lot. As soon as they see price faltering they begin to sell, and the result is a somewhat arbitrary large range in daily price. Stocks that close up the afternoon before on low volume are especially vulnerable. Market makers are so close to the real buying and selling that they will fade the open. The Kmart equity curves follow the same general pattern as AOL. Using Bollinger and RSI gave a gradual increase and resulted in $2,149 from a 1996 investment of $1,000, versus the $1,267 using buy-and-hold. RSI alone resulted in $2,070 but did this by catching up in the last few weeks with a somewhat wild ride. However, the winner is Bollinger bands using weighted closes with RSI at $2,769, because it kept its losses low and made better gains, while incurring modest win/loss trading degradation. The results of the two systems are: Bollinger bands using weighted averages and RSI: Total wining/losing trades: 34/32 Largest win/loss: $307/$110 Most consecutive wins/losses: 5/6 Bollinger bands and RSI: Total wining/losing trades:31/25 Largest win/loss: $266/139 Most consecutive wins/losses: 7/6 In comparing the price charts of AOL and Kmart from 1996 to the present, both stocks went up to double tops, but after the double tops Kmart then slid on down, while AOL gained back some ground. You would expect that in a system only taking long positions there would be fewer long trades for Kmart as opposed to AOL, although not by much. The system behaves the way you would expect based on a quick look at the two charts for long positions, namely 56 trades for Kmart and 68 trades for AOL, comparing the use of Bollinger bands with RSI for both. |
Market index trading on a daily basis.
| Title: | Staff Writer |
| Company: | Technical Analysis, Inc. |
| Address: | 4757 California Ave SW |
| Seattle, WA 98116-4499 | |
| Phone # for sales: | 206 938 0570 |
| Fax: | 206 938 1307 |
| Website: | www.traders.com |
| E-mail address: | dpeterson@traders.com |
Traders' Resource Links | |
| Charting the Stock Market: The Wyckoff Method -- Books | |
| Working-Money.com -- Online Trading Services | |
| Traders.com Advantage -- Online Trading Services | |
| Technical Analysis of Stocks & Commodities -- Publications and Newsletters | |
| Working Money, at Working-Money.com -- Publications and Newsletters | |
| Traders.com Advantage -- Publications and Newsletters | |
| Professional Traders Starter Kit -- Software | |
Click here for more information about our publications!
Comments
Date: 04/07/01Rank: 4Comment:

Request Information From Our Sponsors
- StockCharts.com, Inc.
- Candle Patterns
- Candlestick Charting Explained
- Intermarket Technical Analysis
- John Murphy on Chart Analysis
- John Murphy's Chart Pattern Recognition
- John Murphy's Market Message
- MurphyExplainsMarketAnalysis-Intermarket Analysis
- MurphyExplainsMarketAnalysis-Visual Analysis
- StockCharts.com
- Technical Analysis of the Financial Markets
- The Visual Investor
- VectorVest, Inc.
- Executive Premier Workshop
- One-Day Options Course
- OptionsPro
- Retirement Income Workshop
- Sure-Fire Trading Systems (VectorVest, Inc.)
- Trading as a Business Workshop
- VectorVest 7 EOD
- VectorVest 7 RealTime/IntraDay
- VectorVest AutoTester
- VectorVest Educational Services
- VectorVest OnLine
- VectorVest Options Analyzer
- VectorVest ProGraphics v6.0
- VectorVest ProTrader 7
- VectorVest RealTime Derby Tool
- VectorVest Simulator
- VectorVest Variator
- VectorVest Watchdog
