HOT TOPICS LIST
- MACD
- Fibonacci
- RSI
- Gann
- ADXR
- Stochastics
- Volume
- Triangles
- Futures
- Cycles
- Volatility
- ZIGZAG
- MESA
- Retracement
- Aroon
INDICATORS LIST
LIST OF TOPICS
PRINT THIS ARTICLE
by Gary Grosschadl
When the DJIA plunged 2,000 points in four weeks, it fulfilled a topping pattern.
Position: Buy
Gary Grosschadl
Independent Canadian equities trader and technical analyst based in Peterborough
Ontario, Canada.
PRINT THIS ARTICLE
HEAD & SHOULDERS
A Pattern Completion For The Weekly Dow Chart
01/31/08 07:22:27 AMby Gary Grosschadl
When the DJIA plunged 2,000 points in four weeks, it fulfilled a topping pattern.
Position: Buy
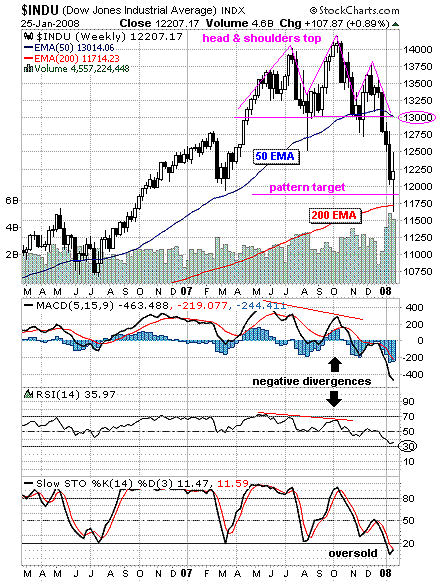
| This multiyear weekly chart clearly shows a topping pattern that went all the way to pattern completion. After hitting a new high of 14,000 last summer, it not surprisingly consolidated those gains by retracing to the 13,000 level for several weeks. This established a potential trendline for the coming pattern. This left shoulder was followed by another thrust beyond 14,000, which became the potential head of the pattern. Finally, the right shoulder was established last December. |
| There was a good indication that a topping pattern was coming even before the trendline was broken with a close below 13,000 late in the year. This came via two negative divergences shown. As the chart made a higher peak breaking above 14,000 (the "head" of the pattern), the moving average convergence/divergence (MACD) and the relative strength index (RSI) both went the other way. When price charts move higher while indicators fail to follow, trouble often signals. Any traders taking proactive action did well in avoiding a 2,000-point correction. |

|
| FIGURE 1: DJIA, WEEKLY. The head & shoulders topping pattern comes to completion with the spike below 12,000 on this chart. |
| Graphic provided by: StockCharts.com. |
| |
| Note that the pattern completion target (downside move below the trendline equal to the distance from top to trendline) also related to a support level near 12,000 (the dip back in the winter of 2007). This level was further enhanced by close proximity to the ever-important 200-period moving average. So a bounce here is no surprise. |
| With the displayed indicators all in oversold territory including the stochastic oscillator, a bounce is expected by technical traders. Now the question is, How high? I expect major resistance back at the trendline of 13,000, which closely relates to the 50-period exponential moving average (EMA) currently 13,014. What happens at that level is telling. |
| In the bear camp, we have the possibility of this being a bear rally to upside resistance and then renewed downside action. Another test of the 200-day EMA then becomes likely. Should bulls prevail at the coming 13,000 test, a possible retest of 14,000 is in the cards. Either way, the next big move could be triggered by breaking either of the two depicted moving averages. Two lines in the sand are clearly drawn by the 200- and 50-period EMAs. |
Independent Canadian equities trader and technical analyst based in Peterborough
Ontario, Canada.
| Website: | www.whatsonsale.ca/financial.html |
| E-mail address: | gwg7@sympatico.ca |
Click here for more information about our publications!
Comments
Date: 01/31/08Rank: 5Comment:
Date: 02/01/08Rank: 4Comment:
Date: 02/05/08Rank: 5Comment:
Date: 02/12/08Rank: 4Comment:

Request Information From Our Sponsors
- VectorVest, Inc.
- Executive Premier Workshop
- One-Day Options Course
- OptionsPro
- Retirement Income Workshop
- Sure-Fire Trading Systems (VectorVest, Inc.)
- Trading as a Business Workshop
- VectorVest 7 EOD
- VectorVest 7 RealTime/IntraDay
- VectorVest AutoTester
- VectorVest Educational Services
- VectorVest OnLine
- VectorVest Options Analyzer
- VectorVest ProGraphics v6.0
- VectorVest ProTrader 7
- VectorVest RealTime Derby Tool
- VectorVest Simulator
- VectorVest Variator
- VectorVest Watchdog
- StockCharts.com, Inc.
- Candle Patterns
- Candlestick Charting Explained
- Intermarket Technical Analysis
- John Murphy on Chart Analysis
- John Murphy's Chart Pattern Recognition
- John Murphy's Market Message
- MurphyExplainsMarketAnalysis-Intermarket Analysis
- MurphyExplainsMarketAnalysis-Visual Analysis
- StockCharts.com
- Technical Analysis of the Financial Markets
- The Visual Investor
