HOT TOPICS LIST
- MACD
- Fibonacci
- RSI
- Gann
- ADXR
- Stochastics
- Volume
- Triangles
- Futures
- Cycles
- Volatility
- ZIGZAG
- MESA
- Retracement
- Aroon
INDICATORS LIST
LIST OF TOPICS
PRINT THIS ARTICLE
by Chaitali Mohile
The bearish flag & pennant pattern saw upside breakout, and the technicals suggest consolidation following.
Position: N/A
Chaitali Mohile
Active trader in the Indian stock markets since 2003 and a full-time writer. Trading is largely based upon technical analysis.
PRINT THIS ARTICLE
CONSOLID FORMATION
Transportation Index Surges From Bearish Pattern
02/06/08 10:39:50 AMby Chaitali Mohile
The bearish flag & pennant pattern saw upside breakout, and the technicals suggest consolidation following.
Position: N/A
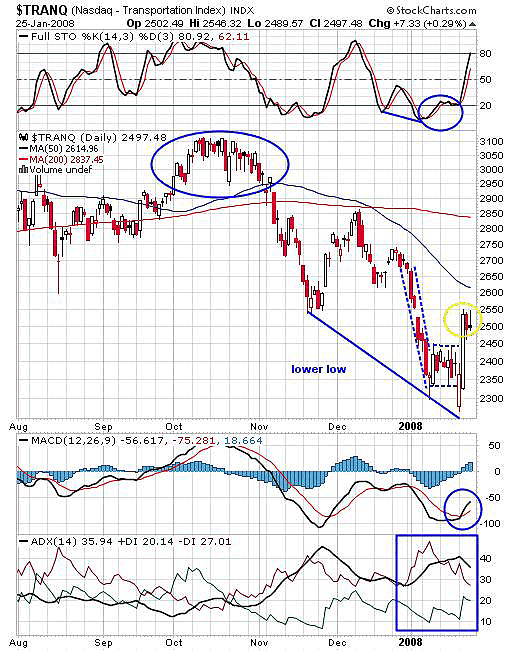
| According to Figure 1, the transportation index ($TRANQ) reached its top during October-November 2007, where it consolidated before lowering. The index formed a rounded top about this time; though the pattern was formed in a short span of about four weeks, the breakdown from moving average reversed the previous uptrend. The overbought stochastic (14,3,3) turned oversold with the loss of 300 points in the index. However, the declining indicator showed the volatile downside. The stochastic showed shaky moves at oversold levels, indicating a temporary pause to correction. Meanwhile, the price enters a small consolidation at the first low of 2550. The oversold levels and price consolidation both put together accumulated strength for a pullback. |
| The pullback of approximately 300 points (2550-2850) faced the resistance of a 200-day moving average and a 50-day moving average. In addition, the moving averages had a bearish crossover, weakening the pullback further. The stochastic and price were dragged down and lower lows were formed. After the second plunge from 2750 to 2350, the index consolidated in the range of 50-75 points. The spikes violated the lower range and formed a lower low at 2300 and 2350. The huge correction followed by a lower consolidation formed a bearish flag & pennant pattern that broke out downward, and continued the descending move. In Figure 1 the index has broken in the opposite direction in a single trading session. Therefore, the bearish pattern failed and now, new bulls are about to come back into the transportation index. The index is consolidating while the entire market drifted to lows. |

|
| FIGURE 1: TRANSPORTATION INDEX. This index reached its top in the October –November period. |
| Graphic provided by: StockCharts.com. |
| |
| Will the consolidation sustain or the index slump to upper range resistance turned support? The stochastic (14,3,3) has rallied in the bullish area, therefore indicating the strength in the consolidation. The moving average convergence/divergence (MACD) (12,26,9) shows a bullish crossover in negative territory and the histogram has already moved above zero line so the moderate bullish force can be seen in the index with volatility coming from other markets, domestic as well as foreign. In contrast, the average directional index shows declining downtrend and the positive directional index (+DI), negative directional index (-DI) are moving closer to each other. So the consolidation may continue. |

|
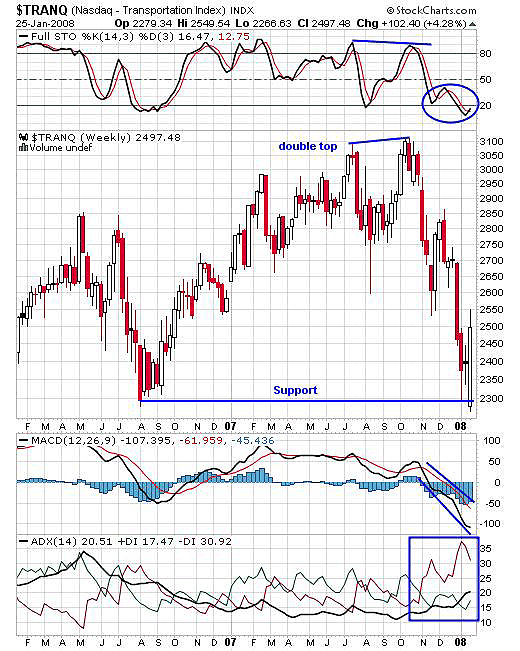
| FIGURE 2: TRANSPORTATION INDEX, WEEKLY. Will the support level be sustained? |
| Graphic provided by: StockCharts.com. |
| |
| The index has been rallying since August 2006 from lows at 2300 and approached an all-time high at 3100 in July 2007. The index tumbled as a double top was formed at these high levels. The recent data shows that the index is back to its potential support area, so it is likely to establish strong support here. The stochastic is highly overbought and therefore ready to bring bulls. The average directional movement index (ADX) (14) is turning on the developing trend, but the fight between -DI and +DI may decide whether the trend is up or down. The MACD (12,26,9) is still negative and therefore needs confirmation. |
| Figure 2 shows the possibility of sustaining the support, but volatility would be more if the rally begins. Consolidating at current levels would increase the strength to a bullish breakout from a bearish pattern and the index may weather the storm. |
Active trader in the Indian stock markets since 2003 and a full-time writer. Trading is largely based upon technical analysis.
| Company: | Independent |
| Address: | C1/3 Parth Indraprasth Towers. Vastrapur |
| Ahmedabad, Guj 380015 | |
| E-mail address: | chaitalimohile@yahoo.co.in |
Traders' Resource Links | |
| Independent has not added any product or service information to TRADERS' RESOURCE. | |
Click here for more information about our publications!
PRINT THIS ARTICLE

Request Information From Our Sponsors
- VectorVest, Inc.
- Executive Premier Workshop
- One-Day Options Course
- OptionsPro
- Retirement Income Workshop
- Sure-Fire Trading Systems (VectorVest, Inc.)
- Trading as a Business Workshop
- VectorVest 7 EOD
- VectorVest 7 RealTime/IntraDay
- VectorVest AutoTester
- VectorVest Educational Services
- VectorVest OnLine
- VectorVest Options Analyzer
- VectorVest ProGraphics v6.0
- VectorVest ProTrader 7
- VectorVest RealTime Derby Tool
- VectorVest Simulator
- VectorVest Variator
- VectorVest Watchdog
- StockCharts.com, Inc.
- Candle Patterns
- Candlestick Charting Explained
- Intermarket Technical Analysis
- John Murphy on Chart Analysis
- John Murphy's Chart Pattern Recognition
- John Murphy's Market Message
- MurphyExplainsMarketAnalysis-Intermarket Analysis
- MurphyExplainsMarketAnalysis-Visual Analysis
- StockCharts.com
- Technical Analysis of the Financial Markets
- The Visual Investor
