HOT TOPICS LIST
- MACD
- Fibonacci
- RSI
- Gann
- ADXR
- Stochastics
- Volume
- Triangles
- Futures
- Cycles
- Volatility
- ZIGZAG
- MESA
- Retracement
- Aroon
INDICATORS LIST
LIST OF TOPICS
PRINT THIS ARTICLE
by Mike Carr, CMT
An interesting lunar cycle has correctly forecast rate drops 10 out of 12 times in the past year.
Position: N/A
Mike Carr, CMT
Mike Carr, CMT, is a member of the Market Technicians Association, and editor of the MTA's newsletter, Technically Speaking. He is also the author of "Smarter Investing in Any Economy: The Definitive Guide to Relative Strength Investing," and "Conquering the Divide: How to Use Economic Indicators to Catch Stock Market Trends."
PRINT THIS ARTICLE
ASTRO FINANCE
Short-Term Interest Rates And The Moon
01/30/08 09:23:05 AMby Mike Carr, CMT
An interesting lunar cycle has correctly forecast rate drops 10 out of 12 times in the past year.
Position: N/A
| A lunar cycle in the markets has long been the subject of study and speculation. Larry Williams was probably the first to write about this phenomenon when he highlighted a lunar cycle in corn in the 1970s. Since that time, researchers have found the moon to coincide with turning points in other markets, including stocks. |
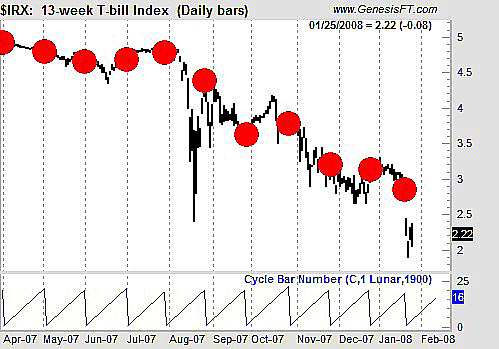
| Last week's dramatic rate cut by the Fed coincided with a full moon. While legend has it that a full moon can cause strange things to happen, it is unlikely that Federal Reserve chairman Ben Bernanke suffers from any type of lunacy. He was responding to a market crisis. The odd thing is that these crises tend to occur at the same time as the full moon (Figure 1). |

|
| FIGURE 1: TREASURY BILLS. The red dots show full moons and over the past year, short-term interest rates (as measured by the 13-week Treasury bill) have usually declined at these times. |
| Graphic provided by: Trade Navigator. |
| |
| In Figure 1, we can see that there was a full moon right before nearly all large interest rate declines. Only one decline, in October 2007, occurred ahead of the full moon. And, although two signals were flat, there were no large losing trades from this simple timing indicator. |
| There isn't much to say about this strategy. Buying Treasury bills the day before a full moon and selling one to three days later would have been profitable in 2007. Will this trend continue? In trading, the past is no guarantee of future performance. But the full moon might be something to watch for those trading T-bills as additional support for confirming a long position. |
| And for those wondering, the next full moon is February 20, 2008. |
Mike Carr, CMT, is a member of the Market Technicians Association, and editor of the MTA's newsletter, Technically Speaking. He is also the author of "Smarter Investing in Any Economy: The Definitive Guide to Relative Strength Investing," and "Conquering the Divide: How to Use Economic Indicators to Catch Stock Market Trends."
| Website: | www.moneynews.com/blogs/MichaelCarr/id-73 |
| E-mail address: | marketstrategist@gmail.com |
Click here for more information about our publications!
Comments
Date: 01/31/08Rank: 1Comment:

Request Information From Our Sponsors
- StockCharts.com, Inc.
- Candle Patterns
- Candlestick Charting Explained
- Intermarket Technical Analysis
- John Murphy on Chart Analysis
- John Murphy's Chart Pattern Recognition
- John Murphy's Market Message
- MurphyExplainsMarketAnalysis-Intermarket Analysis
- MurphyExplainsMarketAnalysis-Visual Analysis
- StockCharts.com
- Technical Analysis of the Financial Markets
- The Visual Investor
- VectorVest, Inc.
- Executive Premier Workshop
- One-Day Options Course
- OptionsPro
- Retirement Income Workshop
- Sure-Fire Trading Systems (VectorVest, Inc.)
- Trading as a Business Workshop
- VectorVest 7 EOD
- VectorVest 7 RealTime/IntraDay
- VectorVest AutoTester
- VectorVest Educational Services
- VectorVest OnLine
- VectorVest Options Analyzer
- VectorVest ProGraphics v6.0
- VectorVest ProTrader 7
- VectorVest RealTime Derby Tool
- VectorVest Simulator
- VectorVest Variator
- VectorVest Watchdog
