HOT TOPICS LIST
- MACD
- Fibonacci
- RSI
- Gann
- ADXR
- Stochastics
- Volume
- Triangles
- Futures
- Cycles
- Volatility
- ZIGZAG
- MESA
- Retracement
- Aroon
INDICATORS LIST
LIST OF TOPICS
PRINT THIS ARTICLE
by Mike Carr, CMT
With the Federal Reserve pushing down short-term rates, the bond market seems to be worried about inflation and is resisting the Fed's efforts on the long end of the yield curve.
Position: Sell
Mike Carr, CMT
Mike Carr, CMT, is a member of the Market Technicians Association, and editor of the MTA's newsletter, Technically Speaking. He is also the author of "Smarter Investing in Any Economy: The Definitive Guide to Relative Strength Investing," and "Conquering the Divide: How to Use Economic Indicators to Catch Stock Market Trends."
PRINT THIS ARTICLE
TRADING SYSTEMS
Have Long-Term Rates Bottomed?
01/28/08 09:49:47 AMby Mike Carr, CMT
With the Federal Reserve pushing down short-term rates, the bond market seems to be worried about inflation and is resisting the Fed's efforts on the long end of the yield curve.
Position: Sell
| With an economic slowdown on the horizon in an election year, the Federal Reserve, Congress, and the President are all doing something. While their actions may drive down short-term interest rates, the government has surprisingly little control over long-term rates. These rates are established by the markets, and market participants may be showing signs of nervousness. Fiscal stimulus in the form of tax rebates, combined with low interest rates engineered by the Fed as monetary stimulus, could be inflationary. And inflation concerns will put upward pressure on long-term rates. |
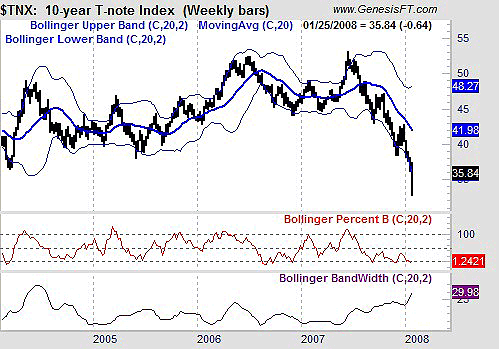
| On a weekly chart, the 10-year Treasury note interest rate seems to have exhausted its movement to the downside. In Figure 1, we see that the Bollinger bandwidth (bottom panel in the chart) has moved sharply higher, indicating that volatility has spiked. Volatility has been shown to be very cyclical, with high-volatility periods usually being followed by low-volatility trading ranges. With the interest rate testing its lower Bollinger Band, it is likely that it will consolidate at this level, and trade upward toward its 20-day moving average. |

|
| FIGURE 1: BOLLINGER BANDWIDTH. With Bollinger bandwidth at a four-year high, volatility is likely to subside and interest rates are likley to move toward the 20-week moving average. |
| Graphic provided by: Trade Navigator. |
| |
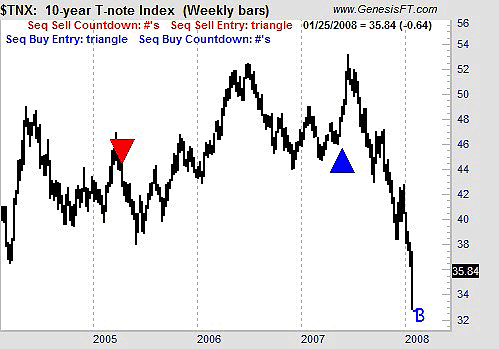
| Figure 2 shows an indicator widely followed by professional traders. The DeMark sequential is an overbought/oversold indicator developed by Tom DeMark that seeks to identify tops and bottoms. The logic is very detailed, but basically it consists of a setup, a countdown, and a signal. The setup criteria for a buy signal requires nine consecutive daily price closes that are lower than the close four days earlier. This indicates the trend has reversed. Then the countdown begins where we look for 13 closes that are lower than the close two days earlier, and these need not be consecutive. The buy occurs when there is an up close after a 13 has been recorded and would occur this week if the market closes higher. |

|
| FIGURE 2: 10-YEAR T-NOTE. The last two DeMark sequentials correctly identified market turning points. On January 25, the countdown reached 13 and will give a buy signal the next time the market closes higher on a weekly basis. |
| Graphic provided by: Trade Navigator. |
| |
| The signals are rare, but usually profitable. Last week, the 10-year interest rate completed a 13 on the buy countdown. Being this oversold, the market has most likely put in a bottom and traders should prepare for higher long-term rates. One way to do this is shorting ETFs like iShares Lehman 20+ Year Treasury Bond (TLT). |
Mike Carr, CMT, is a member of the Market Technicians Association, and editor of the MTA's newsletter, Technically Speaking. He is also the author of "Smarter Investing in Any Economy: The Definitive Guide to Relative Strength Investing," and "Conquering the Divide: How to Use Economic Indicators to Catch Stock Market Trends."
| Website: | www.moneynews.com/blogs/MichaelCarr/id-73 |
| E-mail address: | marketstrategist@gmail.com |
Click here for more information about our publications!
Comments
Date: 01/28/08Rank: 1Comment:

Request Information From Our Sponsors
- VectorVest, Inc.
- Executive Premier Workshop
- One-Day Options Course
- OptionsPro
- Retirement Income Workshop
- Sure-Fire Trading Systems (VectorVest, Inc.)
- Trading as a Business Workshop
- VectorVest 7 EOD
- VectorVest 7 RealTime/IntraDay
- VectorVest AutoTester
- VectorVest Educational Services
- VectorVest OnLine
- VectorVest Options Analyzer
- VectorVest ProGraphics v6.0
- VectorVest ProTrader 7
- VectorVest RealTime Derby Tool
- VectorVest Simulator
- VectorVest Variator
- VectorVest Watchdog
- StockCharts.com, Inc.
- Candle Patterns
- Candlestick Charting Explained
- Intermarket Technical Analysis
- John Murphy on Chart Analysis
- John Murphy's Chart Pattern Recognition
- John Murphy's Market Message
- MurphyExplainsMarketAnalysis-Intermarket Analysis
- MurphyExplainsMarketAnalysis-Visual Analysis
- StockCharts.com
- Technical Analysis of the Financial Markets
- The Visual Investor
