HOT TOPICS LIST
- MACD
- Fibonacci
- RSI
- Gann
- ADXR
- Stochastics
- Volume
- Triangles
- Futures
- Cycles
- Volatility
- ZIGZAG
- MESA
- Retracement
- Aroon
INDICATORS LIST
LIST OF TOPICS
PRINT THIS ARTICLE
by Mike Carr, CMT
Over the past 20 years, February has been a down month. While seasonals are just one indicator, they add to the bearish case in a down market.
Position: Sell
Mike Carr, CMT
Mike Carr, CMT, is a member of the Market Technicians Association, and editor of the MTA's newsletter, Technically Speaking. He is also the author of "Smarter Investing in Any Economy: The Definitive Guide to Relative Strength Investing," and "Conquering the Divide: How to Use Economic Indicators to Catch Stock Market Trends."
PRINT THIS ARTICLE
SEASONAL TRADING
February Not The Best Time To Buy
01/28/08 09:43:08 AMby Mike Carr, CMT
Over the past 20 years, February has been a down month. While seasonals are just one indicator, they add to the bearish case in a down market.
Position: Sell
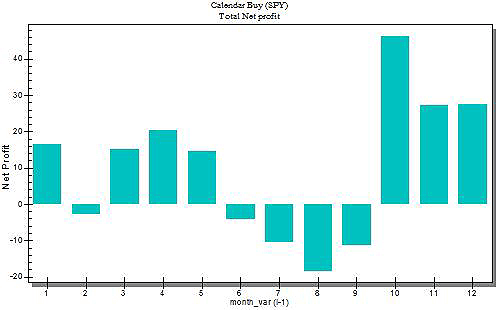
| If you had bought the S&P 500 ETF (SPY) on the first of February and held for the next four weeks, you would show a small loss in your account after 20 years. The second month of the year is one of five months that show a loss with that strategy (Figure 1). Given that retirement account contributions might be delayed this year as cash-strapped investors hope for an early tax rebate and we are already in a bear market by some measures, there is no reason to expect this year to be any different. |

|
| FIGURE 1: SPY. This chart shows the net profit if you had bought SPY on the first of each month and sold four weeks later. February is one of five down months for the SPY over the past two decades. |
| Graphic provided by: Trade Navigator. |
| |
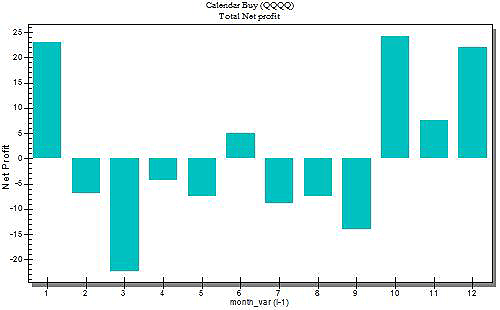
| The NASDAQ 100 has an even stronger seasonal tendency. Again buying on the first day of the month and holding for four weeks would have resulted in losses for the month of February. This index, on average, gets all of its gains from a single four-month stretch (Figure 2). In fact, February begins an extended bearish seasonal period for the NASDAQ 100 ETF (QQQQ) that lasts through September. |

|
| FIGURE 2: NASDAQ 100. The NASDAQ 100, traded as the QQQQ, is even more bearish than SPY at this time of year. |
| Graphic provided by: Trade Navigator. |
| |
| Traders can profit from this knowledge by overweighting shorts over the next month. Shorting the QQQQ appears to be a low-risk trade, but in today's market with extremely sharp moves occurring all the time, a stop needs to be used and that is dependent solely upon an investor's personal risk tolerance. |
Mike Carr, CMT, is a member of the Market Technicians Association, and editor of the MTA's newsletter, Technically Speaking. He is also the author of "Smarter Investing in Any Economy: The Definitive Guide to Relative Strength Investing," and "Conquering the Divide: How to Use Economic Indicators to Catch Stock Market Trends."
| Website: | www.moneynews.com/blogs/MichaelCarr/id-73 |
| E-mail address: | marketstrategist@gmail.com |
Click here for more information about our publications!
Comments
Date: 01/28/08Rank: 1Comment:

Request Information From Our Sponsors
- VectorVest, Inc.
- Executive Premier Workshop
- One-Day Options Course
- OptionsPro
- Retirement Income Workshop
- Sure-Fire Trading Systems (VectorVest, Inc.)
- Trading as a Business Workshop
- VectorVest 7 EOD
- VectorVest 7 RealTime/IntraDay
- VectorVest AutoTester
- VectorVest Educational Services
- VectorVest OnLine
- VectorVest Options Analyzer
- VectorVest ProGraphics v6.0
- VectorVest ProTrader 7
- VectorVest RealTime Derby Tool
- VectorVest Simulator
- VectorVest Variator
- VectorVest Watchdog
- StockCharts.com, Inc.
- Candle Patterns
- Candlestick Charting Explained
- Intermarket Technical Analysis
- John Murphy on Chart Analysis
- John Murphy's Chart Pattern Recognition
- John Murphy's Market Message
- MurphyExplainsMarketAnalysis-Intermarket Analysis
- MurphyExplainsMarketAnalysis-Visual Analysis
- StockCharts.com
- Technical Analysis of the Financial Markets
- The Visual Investor
