HOT TOPICS LIST
- MACD
- Fibonacci
- RSI
- Gann
- ADXR
- Stochastics
- Volume
- Triangles
- Futures
- Cycles
- Volatility
- ZIGZAG
- MESA
- Retracement
- Aroon
INDICATORS LIST
LIST OF TOPICS
PRINT THIS ARTICLE
by Kevin Hopson
Even though the VIX is finding resistance around last August's high, the recent pattern breakout could act as a catalyst for higher prices.
Position: N/A
Kevin Hopson
Kevin has been a technical analyst for roughly 10 years now. Previously, Kevin owned his own business and acted as a registered investment advisor, specializing in energy. He was also a freelance oil analyst for Orient Trading Co., a commodity futures trading firm in Japan. Kevin is currently a freelance writer.
PRINT THIS ARTICLE
VOLATILITY
VIX Breakout Could Signal Further Market Weakness
01/24/08 08:44:24 AMby Kevin Hopson
Even though the VIX is finding resistance around last August's high, the recent pattern breakout could act as a catalyst for higher prices.
Position: N/A
| The Chicago Board Options Exchange Volatility Index (VIX) measures investor fear/volatility via options trading for the Standard & Poor's 500. The VIX tends to move in the opposite direction of the S&P 500, which means it can act as a contrarian indicator when volatility reaches extreme levels. Unfortunately for the bulls, the VIX may have higher to go before signaling a bottom in the market. |
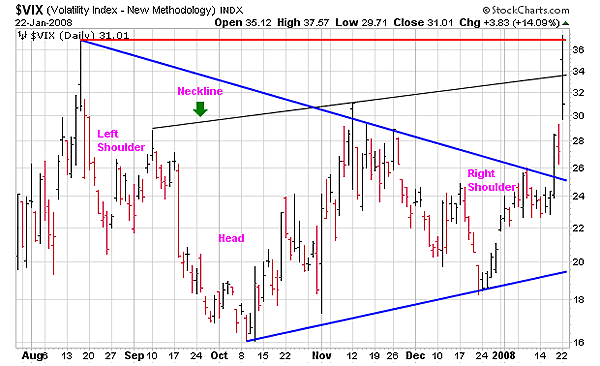
| If you look at the six-month chart (Figure 1), you will see that the VIX has broken out of a symmetrical triangle pattern. By taking the base of the triangle (high point - low point ) and adding this figure (37 - 16 = 21) to the breakout point (25), you come up with a potential price target of 46. |

|
| FIGURE 1: VIX, SIX MONTHS. Note that the VIX has broken out of a symmetrical triangle pattern. |
| Graphic provided by: StockCharts.com. |
| |
| In addition, it appears that the VIX has broken out of a reverse head & shoulders pattern, which formed within the symmetrical triangle. If this pattern is accurate, it would coincide with the price target I mentioned. For example, if you measure the distance from the completion point of the left shoulder (29) to the bottom of the head (16) and then add this number (29 - 16 = 13) to the neckline breakout point (34), you come up with an estimated price target of 47. In other words, the two patterns indicate a target range of 46–47. |
| Since the VIX met resistance around last August's high (as illustrated by the red line), the index could pull back in the near term, possibly to the mid-20s. The reason I say this is because broken resistance tends to act as support and the triangle breakout point (prior resistance) comes into play around 25. If a pullback of this magnitude does occur, it could create an attractive trading opportunity. More specifically, to hedge against another market downturn, traders might consider buying inverse S&P 500 exchange traded funds (ETFs). ProShares, ProFunds, and Rydex are just a few companies who offer these investment vehicles. |
Kevin has been a technical analyst for roughly 10 years now. Previously, Kevin owned his own business and acted as a registered investment advisor, specializing in energy. He was also a freelance oil analyst for Orient Trading Co., a commodity futures trading firm in Japan. Kevin is currently a freelance writer.
| Glen Allen, VA | |
| E-mail address: | hopson_1@yahoo.com |
Click here for more information about our publications!
Comments
Date: 01/26/08Rank: 4Comment:
Date: 01/29/08Rank: 3Comment:

Request Information From Our Sponsors
- StockCharts.com, Inc.
- Candle Patterns
- Candlestick Charting Explained
- Intermarket Technical Analysis
- John Murphy on Chart Analysis
- John Murphy's Chart Pattern Recognition
- John Murphy's Market Message
- MurphyExplainsMarketAnalysis-Intermarket Analysis
- MurphyExplainsMarketAnalysis-Visual Analysis
- StockCharts.com
- Technical Analysis of the Financial Markets
- The Visual Investor
- VectorVest, Inc.
- Executive Premier Workshop
- One-Day Options Course
- OptionsPro
- Retirement Income Workshop
- Sure-Fire Trading Systems (VectorVest, Inc.)
- Trading as a Business Workshop
- VectorVest 7 EOD
- VectorVest 7 RealTime/IntraDay
- VectorVest AutoTester
- VectorVest Educational Services
- VectorVest OnLine
- VectorVest Options Analyzer
- VectorVest ProGraphics v6.0
- VectorVest ProTrader 7
- VectorVest RealTime Derby Tool
- VectorVest Simulator
- VectorVest Variator
- VectorVest Watchdog
