HOT TOPICS LIST
- MACD
- Fibonacci
- RSI
- Gann
- ADXR
- Stochastics
- Volume
- Triangles
- Futures
- Cycles
- Volatility
- ZIGZAG
- MESA
- Retracement
- Aroon
INDICATORS LIST
LIST OF TOPICS
PRINT THIS ARTICLE
by Koos van der Merwe
A look at the divergence of the commodity channel index on the Wilshire 5000 is telling us something important.
Position: Buy
Koos van der Merwe
Has been a technical analyst since 1969, and has worked as a futures and options trader with First Financial Futures in Johannesburg, South Africa.
PRINT THIS ARTICLE
CCI
Is The Wilshire 5000 Daily Index Giving Us Good News?
01/23/08 09:15:22 AMby Koos van der Merwe
A look at the divergence of the commodity channel index on the Wilshire 5000 is telling us something important.
Position: Buy
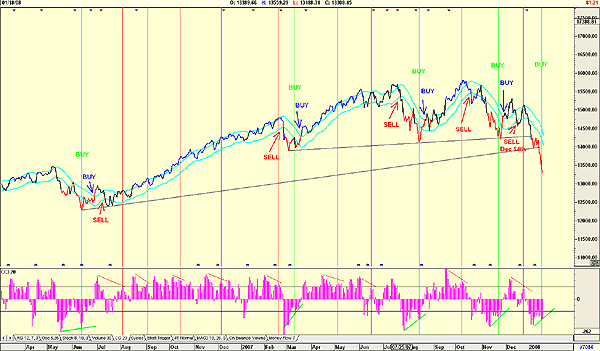
| Figure 1 is the Wilshire 5000 daily index, with the commodity channel index (CCI) 20-period and a JM internal band indicator. The chart shows how the index broke all support levels falling to 13308.45 on January 18 to give sell signals. But — 1. The index broke below the lower boundary of the JM internal band on December 14. It recovered but did not give a buy signal by breaking convincingly above the upper JM band. It then fell to present levels. The JM internal band is a 15-period simple moving average offset by 2% positive and 2% negative. 2. With the CCI 20-period indicator, divergence as shown by the green line has been excellent in predicting a recovery of the index. The buy signals given have been ahead of the JM internal band buy signals. Sell signals as shown by the red vertical line, however, have not been as successful. |

|
| FIGURE 1: WILSHIRE 500 INDEX, DAILY. The index is showing various buy and sell signals. |
| Graphic provided by: AdvancedGET. |
| |
| The divergence buy signal of the CCI-20 period indicator is suggesting a recovery in the market after the recent tumble. How far will it rise? Possibly to test either trendline, the fact that the index forecast that the market would not collapse on January 22 in line with the dramatic fall in Europe and Asia on January 21, Martin Luther King Day, is interesting, and suggests that the indicator could be a leading indicator as far as buy signals are concerned. |
Has been a technical analyst since 1969, and has worked as a futures and options trader with First Financial Futures in Johannesburg, South Africa.
| Address: | 3256 West 24th Ave |
| Vancouver, BC | |
| Phone # for sales: | 6042634214 |
| E-mail address: | petroosp@gmail.com |
Click here for more information about our publications!
PRINT THIS ARTICLE

Request Information From Our Sponsors
- StockCharts.com, Inc.
- Candle Patterns
- Candlestick Charting Explained
- Intermarket Technical Analysis
- John Murphy on Chart Analysis
- John Murphy's Chart Pattern Recognition
- John Murphy's Market Message
- MurphyExplainsMarketAnalysis-Intermarket Analysis
- MurphyExplainsMarketAnalysis-Visual Analysis
- StockCharts.com
- Technical Analysis of the Financial Markets
- The Visual Investor
- VectorVest, Inc.
- Executive Premier Workshop
- One-Day Options Course
- OptionsPro
- Retirement Income Workshop
- Sure-Fire Trading Systems (VectorVest, Inc.)
- Trading as a Business Workshop
- VectorVest 7 EOD
- VectorVest 7 RealTime/IntraDay
- VectorVest AutoTester
- VectorVest Educational Services
- VectorVest OnLine
- VectorVest Options Analyzer
- VectorVest ProGraphics v6.0
- VectorVest ProTrader 7
- VectorVest RealTime Derby Tool
- VectorVest Simulator
- VectorVest Variator
- VectorVest Watchdog
