

HOT TOPICS LIST
- MACD
- Fibonacci
- RSI
- Gann
- ADXR
- Stochastics
- Volume
- Triangles
- Futures
- Cycles
- Volatility
- ZIGZAG
- MESA
- Retracement
- Aroon
INDICATORS LIST
LIST OF TOPICS
PRINT THIS ARTICLE
by Arthur Hill
After holding above its November low, the US Dollar Index looks poised for a run toward long-term resistance.
Position: Accumulate
Arthur Hill
Arthur Hill is currently editor of TDTrader.com, a website specializing in trading strategies, sector/industry specific breadth stats and overall technical analysis. He passed the Society of Technical Analysts (STA London) diploma exam with distinction is a Certified Financial Technician (CFTe). Prior to TD Trader, he was the Chief Technical Analyst for Stockcharts.com and the main contributor to the ChartSchool.
PRINT THIS ARTICLE
MACD
US Dollar Index Perks Up
01/23/08 09:00:07 AMby Arthur Hill
After holding above its November low, the US Dollar Index looks poised for a run toward long-term resistance.
Position: Accumulate
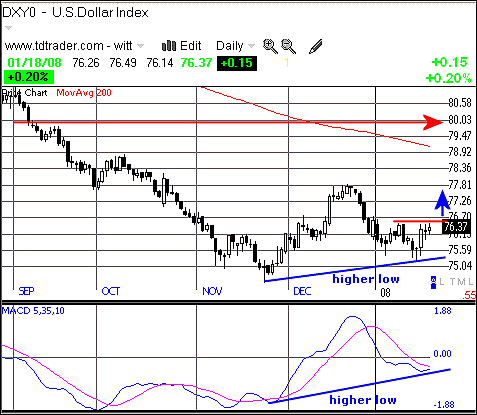
| Figure 1 shows the US Dollar Index ($USD) over the last five months. The index found support around 75 in November 2007 and surged in December 2007. This was followed by a pullback, but the index found support above the November low. This makes for a higher low and a potential trend change could be afoot. I am marking resistance at 76.5 and a break above this level would open the door for a run toward 80. |
|
| FIGURE 1: $USD, DAILY. The index found support around 75 in November and surged in December. |
| Graphic provided by: TeleChart2007. |
| |
| The bottom indicator window shows the moving average convergence/divergence (MACD), but a faster version than the traditional MACD. Instead of using 12- and 26-day moving averages, I am using five- and 35-day moving averages. This makes the indicator more sensitive. A higher low is also possible in the MACD, and a break above the signal line (pink) would be quite positive for momentum. Further strength into positive territory would turn medium-term momentum bullish. |
|
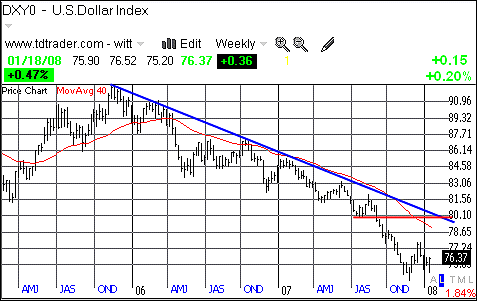
| FIGURE 2: $USD, WEEKLY. Despite the potential for a modest rally, the long-term trend remains down. |
| Graphic provided by: TeleChart2007. |
| |
| Despite the potential for a modest rally, the long-term trend remains down. On the weekly chart (Figure 2), the index is well below its November 2005 trendline. This is the trendline extension and broken support mark resistance around 80. The 40-week moving average also marks resistance around 79. Taken together, a modest rally on the daily chart could meet stiff resistance on the weekly chart. |
Arthur Hill is currently editor of TDTrader.com, a website specializing in trading strategies, sector/industry specific breadth stats and overall technical analysis. He passed the Society of Technical Analysts (STA London) diploma exam with distinction is a Certified Financial Technician (CFTe). Prior to TD Trader, he was the Chief Technical Analyst for Stockcharts.com and the main contributor to the ChartSchool.
| Title: | Editor |
| Company: | TDTrader.com |
| Address: | Willem Geetsstraat 17 |
| Mechelen, B2800 | |
| Phone # for sales: | 3215345465 |
| Website: | www.tdtrader.com |
| E-mail address: | arthurh@tdtrader.com |
Traders' Resource Links | |
| TDTrader.com has not added any product or service information to TRADERS' RESOURCE. | |
Click here for more information about our publications!
Comments
Date:�01/24/08Rank:�3Comment:�

Request Information From Our Sponsors
- StockCharts.com, Inc.
- Candle Patterns
- Candlestick Charting Explained
- Intermarket Technical Analysis
- John Murphy on Chart Analysis
- John Murphy's Chart Pattern Recognition
- John Murphy's Market Message
- MurphyExplainsMarketAnalysis-Intermarket Analysis
- MurphyExplainsMarketAnalysis-Visual Analysis
- StockCharts.com
- Technical Analysis of the Financial Markets
- The Visual Investor
- VectorVest, Inc.
- Executive Premier Workshop
- One-Day Options Course
- OptionsPro
- Retirement Income Workshop
- Sure-Fire Trading Systems (VectorVest, Inc.)
- Trading as a Business Workshop
- VectorVest 7 EOD
- VectorVest 7 RealTime/IntraDay
- VectorVest AutoTester
- VectorVest Educational Services
- VectorVest OnLine
- VectorVest Options Analyzer
- VectorVest ProGraphics v6.0
- VectorVest ProTrader 7
- VectorVest RealTime Derby Tool
- VectorVest Simulator
- VectorVest Variator
- VectorVest Watchdog