HOT TOPICS LIST
- MACD
- Fibonacci
- RSI
- Gann
- ADXR
- Stochastics
- Volume
- Triangles
- Futures
- Cycles
- Volatility
- ZIGZAG
- MESA
- Retracement
- Aroon
INDICATORS LIST
LIST OF TOPICS
PRINT THIS ARTICLE
by Chaitali Mohile
LaBranche is forming a base for a bullish rally.
Position: N/A
Chaitali Mohile
Active trader in the Indian stock markets since 2003 and a full-time writer. Trading is largely based upon technical analysis.
PRINT THIS ARTICLE
CHART ANALYSIS
LaBranche Forming Bottom
01/25/08 08:33:28 AMby Chaitali Mohile
LaBranche is forming a base for a bullish rally.
Position: N/A
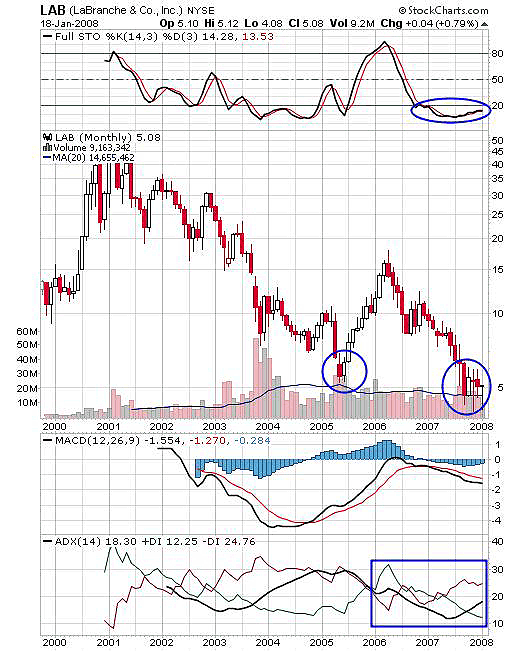
| LaBranche & Co. (LAB) has been in a strong downtrend for the last seven years (see Figure 1). The $50 stock in 2001 ended up worth $5 in 2008. After establishing support at this level, the stock rallied to $15 on comparatively good volume and the stochastic (14,3,3) also touched overbought levels. The stock may recover in time. A strong bullish force is essential for such stock to get back to its previous levels. The moving average convergence/divergence (MACD) (12,26,9) failed to move into positive territory. And though the stock pulled back, the average directional movement index (ADX) was declining with +DI and -DI moving at equal pace. So technically, there was no bullish strength in the pullback rally in 2005. |
| As a result, the stock plunged to the previous low of $5, with the stock consolidating at this lower level. Volatility is high here and the indicators are bearish. The stochastic is flat in a highly oversold area, and for the bullish force the oscillator needs to move above 20. Forming a strong base at this level is healthy for the stock. |

|
| FIGURE 1: LAB, MONTHLY. LAB is consolidating at the previous low support at $5. Holding the support is important to begin an upward rally. |
| Graphic provided by: StockCharts.com. |
| |
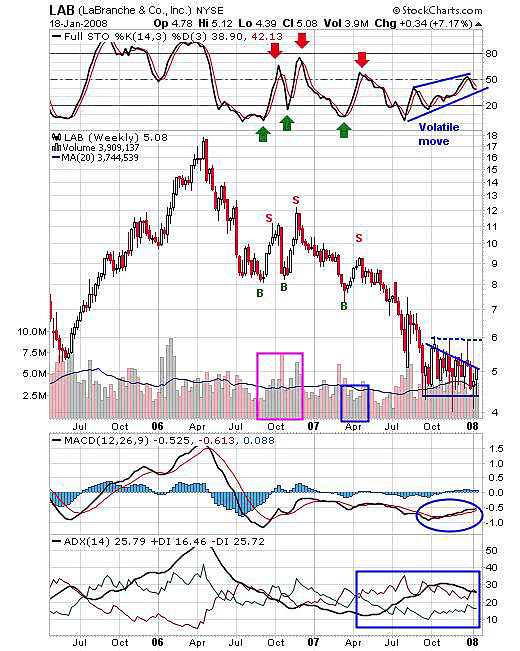
| The weekly chart in Figure 2 shows the two-year scenario. The pullback saw a double-top effect of stochastic (14,3,3), dragging the stock back to its previous lows. The chart also points out that every smallest recovery was traded during the downward journey. In such a situation, I would keep an eye on the stochastic oscillator and volume, which shows trading interest. |
| Since October 2007, the stock has been in a volatile consolidation period in the 5-7 range. The spikes have touched lows below 5 but managed to close near support. While the stock bottomed out, it collected the strength to rally to the upside. The stochastic (14,3,3) surged from the oversold area, but the path was very shaky to move swiftly above 50. Again, the ADX (14) still indicates the downtrend, with +DI (positive directional index) and -DI (negative directional index) moving much closer than earlier. This suggests a consolidation at the lower level. |

|
| FIGURE 2: LAB, WEEKLY. The safe and low-risk trades are possible following the stochastic (14,3,3). The bottom formation would help bring the bullish force in the stock. |
| Graphic provided by: StockCharts.com. |
| |
| During the current crisis in the financial markets, it is better for a stock to consolide than decline. The indicators are showing improved levels than earlier worse-hit areas, so holding this support could bring in bullish strength to the stock. Therefore, forming a bottom at a strong support level would help the stock recover. |
Active trader in the Indian stock markets since 2003 and a full-time writer. Trading is largely based upon technical analysis.
| Company: | Independent |
| Address: | C1/3 Parth Indraprasth Towers. Vastrapur |
| Ahmedabad, Guj 380015 | |
| E-mail address: | chaitalimohile@yahoo.co.in |
Traders' Resource Links | |
| Independent has not added any product or service information to TRADERS' RESOURCE. | |
Click here for more information about our publications!
Comments
Date: 01/26/08Rank: 4Comment:
Date: 01/29/08Rank: 3Comment:

Request Information From Our Sponsors
- StockCharts.com, Inc.
- Candle Patterns
- Candlestick Charting Explained
- Intermarket Technical Analysis
- John Murphy on Chart Analysis
- John Murphy's Chart Pattern Recognition
- John Murphy's Market Message
- MurphyExplainsMarketAnalysis-Intermarket Analysis
- MurphyExplainsMarketAnalysis-Visual Analysis
- StockCharts.com
- Technical Analysis of the Financial Markets
- The Visual Investor
- VectorVest, Inc.
- Executive Premier Workshop
- One-Day Options Course
- OptionsPro
- Retirement Income Workshop
- Sure-Fire Trading Systems (VectorVest, Inc.)
- Trading as a Business Workshop
- VectorVest 7 EOD
- VectorVest 7 RealTime/IntraDay
- VectorVest AutoTester
- VectorVest Educational Services
- VectorVest OnLine
- VectorVest Options Analyzer
- VectorVest ProGraphics v6.0
- VectorVest ProTrader 7
- VectorVest RealTime Derby Tool
- VectorVest Simulator
- VectorVest Variator
- VectorVest Watchdog
