HOT TOPICS LIST
- MACD
- Fibonacci
- RSI
- Gann
- ADXR
- Stochastics
- Volume
- Triangles
- Futures
- Cycles
- Volatility
- ZIGZAG
- MESA
- Retracement
- Aroon
INDICATORS LIST
LIST OF TOPICS
PRINT THIS ARTICLE
by Chaitali Mohile
After a symmetrical triangle breakdown, XLB is dragged below its initial support and may continue the decline.
Position: N/A
Chaitali Mohile
Active trader in the Indian stock markets since 2003 and a full-time writer. Trading is largely based upon technical analysis.
PRINT THIS ARTICLE
TECHNICAL ANALYSIS
Material Select Sector May Retest Other Supports
01/24/08 08:10:45 AMby Chaitali Mohile
After a symmetrical triangle breakdown, XLB is dragged below its initial support and may continue the decline.
Position: N/A
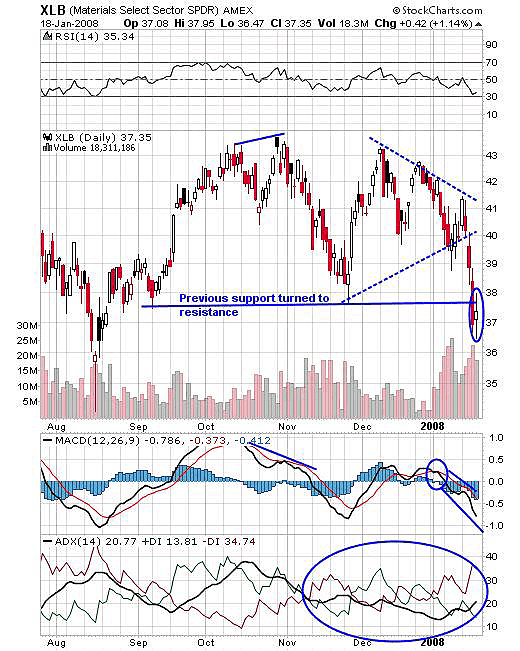
| For XLB, 43 was its all-time high. Strong resistance was formed there, which restricted the index to move ahead. The new high was achieved with the support of the 38 level, while the index came back to retest this level in December 2007. The moving average convergence/divergence (MACD) saw a negative divergence while XLB was racing the bulls. As you can see, the index returned toward its earlier support. A second attempt was made to violate the previous high at 43 but the index failed again, thereafter forming lower highs and higher lowers without retracing back to its previous support level. The symmetrical triangle was formed during this shaky movement that later broke in a downward direction as the range narrowed. |
| The breakout direction for a symmetrical triangle is uncertain, and can only be known when it occurs. In Figure 1, after the downside breakout prices fell to the support level of 38. The closing on January 17 brought in bearish force and the the low of the trading day violated this support level. But on the following trading day, XLB opened higher, moved lower than the previous close during the trading day, but ultimately closed within the previous day's range. The spinning top that was formed on January 18 indicated indecision by bulls and bears. Along with recession worries in the market, the new resistance kept traders preoccupied. |

|
| FIGURE 1: XLB, DAILY. The lowest support below 35 may get tested under the resistance of 38 and the bearish force by the indicators. |
| Graphic provided by: StockCharts.com. |
| |
| The indicators, particularly moving average convergence/divergence (MACD)(12,26,9) and average directional movement index (ADX)(14) give a bearish picture. The MACD (12,26,9) has moved to the negative zone and the ADX (14) is moving above 20 with increasing selling pressure, so bears probably conquer the trend. However, the relative strength index (RSI)(14) lacked the strength to carry the rally on either side. |
| Meanwhile, the European and Asian markets faced its worst days in history. Most of these markets are running much lower than any supports on their technicals. The slowdown in the US economy is a much-worried-about factor that is affecting other markets across the world. Under these circumstances, XLB is likely to lose more and the closest support below 35 may get tested. |
Active trader in the Indian stock markets since 2003 and a full-time writer. Trading is largely based upon technical analysis.
| Company: | Independent |
| Address: | C1/3 Parth Indraprasth Towers. Vastrapur |
| Ahmedabad, Guj 380015 | |
| E-mail address: | chaitalimohile@yahoo.co.in |
Traders' Resource Links | |
| Independent has not added any product or service information to TRADERS' RESOURCE. | |
Click here for more information about our publications!
Comments
Date: 01/25/08Rank: 5Comment:

|

Request Information From Our Sponsors
- StockCharts.com, Inc.
- Candle Patterns
- Candlestick Charting Explained
- Intermarket Technical Analysis
- John Murphy on Chart Analysis
- John Murphy's Chart Pattern Recognition
- John Murphy's Market Message
- MurphyExplainsMarketAnalysis-Intermarket Analysis
- MurphyExplainsMarketAnalysis-Visual Analysis
- StockCharts.com
- Technical Analysis of the Financial Markets
- The Visual Investor
- VectorVest, Inc.
- Executive Premier Workshop
- One-Day Options Course
- OptionsPro
- Retirement Income Workshop
- Sure-Fire Trading Systems (VectorVest, Inc.)
- Trading as a Business Workshop
- VectorVest 7 EOD
- VectorVest 7 RealTime/IntraDay
- VectorVest AutoTester
- VectorVest Educational Services
- VectorVest OnLine
- VectorVest Options Analyzer
- VectorVest ProGraphics v6.0
- VectorVest ProTrader 7
- VectorVest RealTime Derby Tool
- VectorVest Simulator
- VectorVest Variator
- VectorVest Watchdog
