HOT TOPICS LIST
- MACD
- Fibonacci
- RSI
- Gann
- ADXR
- Stochastics
- Volume
- Triangles
- Futures
- Cycles
- Volatility
- ZIGZAG
- MESA
- Retracement
- Aroon
INDICATORS LIST
LIST OF TOPICS
PRINT THIS ARTICLE
by Paolo Pezzutti
There are no indications of a reversal; bad news and the generally negative sentiment could bring prices excessively lower.
Position: N/A
Paolo Pezzutti
Author of the book "Trading the US Markets - A Comprehensive Guide to US Markets for International Traders and Investors" - Harriman House (July 2008)
PRINT THIS ARTICLE
TECHNICAL ANALYSIS
With Financial Select Sector SPDR ETF, The Downtrend Continues
01/23/08 08:30:09 AMby Paolo Pezzutti
There are no indications of a reversal; bad news and the generally negative sentiment could bring prices excessively lower.
Position: N/A
| Writing about financial stocks can be compromising. Volatility is so high and news is affecting the performance of this sector that trying to forecast a scenario can be difficult. The instabilities of last summer were triggered by losses through sub-prime mortgage lending in the US and have developed adverse global economic impacts. More than 86,000 mortgage jobs were cut in 2007 and the mortgage industry is facing a very difficult year in 2008 as housing prices declined and delinquencies and defaults rose rapidly. On the financial side, the Financial Select Sector SPDR ETF (XLF) fell to the lowest price seen since 2003, with most of its heavily weighted components contributing to losses. The financial instability and the credit crunch are still ongoing and their consequences will likely continue to affect markets. Bad news continues to hit markets and negatively impact stock prices. You shouldn't be surprised if a big player comes up with bankruptcy news. The crisis is not over and it will continue for quite some time, especially since everybody is talking about a recession in the US. And this is in spite of the Fed displaying its intention to intervene aggressively by lowering interest rates. My view is that bad news and emotions will drive prices excessively low, creating buying opportunities. Timing the peak of the crisis will not be easy, although you may want eventually to be a buyer of this sector, which represents the heart of the economic system of any nation. |
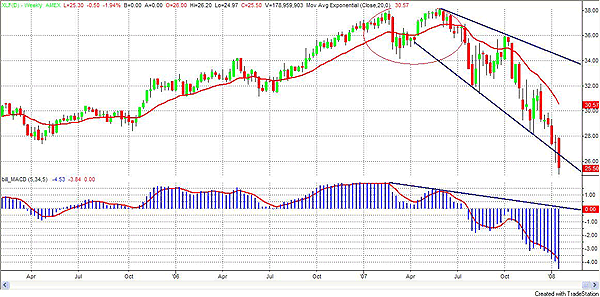
| The XLF is a nice instrument for those who do not want to take positions on a single stock but want to diversify their investment. The XLF provides a good opportunity in this regard. Some of the companies composing the XLF are very important companies, such as Bank of America, Citigroup, JPMorgan Chase, Goldman Sachs Group, Morgan Stanley, and Merrill Lynch. Let's focus now on the technical side to try and not take into account the negative sentiment that is surrounding these stocks. In Figure 1, you can see the weekly chart of the XLF. After the double top printed in June last year in coincidence with a negative divergence of the moving average convergence/divergence (MACD), prices started a steep downtrend, losing about 30% so far. Prices are moving within a diverging channel and have engaged repeatedly in the lower trendline. You can also see that the MACD continues to print new lows, indicating that for the moment we cannot expect much in the medium term. The trend remains negative. At the same time, it is quite impossible to try and spot the low of this down move. |

|
| FIGURE 1: XLF, WEEKLY. The MACD is confirming the new lows of prices. So far there is no indication of a reversal in this time frame. |
| Graphic provided by: TradeStation. |
| |
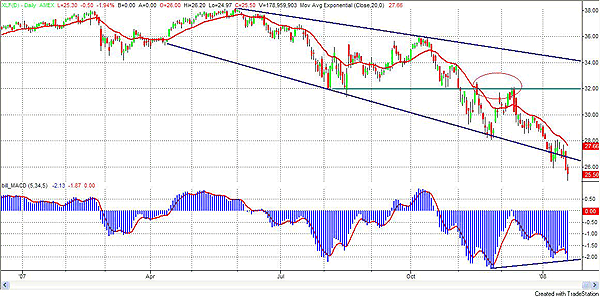
| In Figure 2, you can see the daily chart of XLF. In this time frame, the XLF is trading below the lower trendline of the descending channel, indicating the extremely difficult situation of the sector. Note that when prices attempted a rebound in November and December, they did not manage to break out of the static resistance level at $32, which was in the middle of the channel. This was a sign of weakness before prices resumed the downtrend. The MACD is printing a slight positive divergence, but the general situation is very negative. The length of the ongoing down leg will be very important to understand the strength of the downtrend. There could be also an acceleration of the move and a final climax. There is, in fact, the possibility of additional bad news, the emotions of which would hit the market in an excessive way. All you can expect is a rebound, but so far there are no elements. Key levels for a rebound, should it occur, are $26 and $28. To the downside, the first support and objective is at $24. |

|
| FIGURE 2: XLF, DAILY. The XLF is printing a slight positive divergence of the MACD. There are no indications of a reversal unless prices reenter the trading range within the descending channel and break out the resistance levels at $26 and $28. |
| Graphic provided by: TradeStation. |
| |
| I would monitor the XLF to eventually be a buyer. Timing is very difficult and risky. Neither on the weekly and daily time frames are there indications of a reversal in the medium and short term. You have also to be aware that bad news and a general negative sentiment toward the sector could push prices too much to the downside. Instead of attempting to buy new lows, I would await a technical reversal pattern that would help identify a good risk-reward opportunity and a defined stop-loss. |
Author of the book "Trading the US Markets - A Comprehensive Guide to US Markets for International Traders and Investors" - Harriman House (July 2008)
| Address: | VIA ROBERTO AGO 26 POSTAL CODE 00166 |
| Rome, ITALY | |
| Phone # for sales: | +393357540708 |
| E-mail address: | pezzutti.paolo@tiscali.it |
Click here for more information about our publications!
Comments
Date: 01/24/08Rank: 4Comment:
Date: 01/25/08Rank: 5Comment:

Request Information From Our Sponsors
- StockCharts.com, Inc.
- Candle Patterns
- Candlestick Charting Explained
- Intermarket Technical Analysis
- John Murphy on Chart Analysis
- John Murphy's Chart Pattern Recognition
- John Murphy's Market Message
- MurphyExplainsMarketAnalysis-Intermarket Analysis
- MurphyExplainsMarketAnalysis-Visual Analysis
- StockCharts.com
- Technical Analysis of the Financial Markets
- The Visual Investor
- VectorVest, Inc.
- Executive Premier Workshop
- One-Day Options Course
- OptionsPro
- Retirement Income Workshop
- Sure-Fire Trading Systems (VectorVest, Inc.)
- Trading as a Business Workshop
- VectorVest 7 EOD
- VectorVest 7 RealTime/IntraDay
- VectorVest AutoTester
- VectorVest Educational Services
- VectorVest OnLine
- VectorVest Options Analyzer
- VectorVest ProGraphics v6.0
- VectorVest ProTrader 7
- VectorVest RealTime Derby Tool
- VectorVest Simulator
- VectorVest Variator
- VectorVest Watchdog
