HOT TOPICS LIST
- MACD
- Fibonacci
- RSI
- Gann
- ADXR
- Stochastics
- Volume
- Triangles
- Futures
- Cycles
- Volatility
- ZIGZAG
- MESA
- Retracement
- Aroon
INDICATORS LIST
LIST OF TOPICS
PRINT THIS ARTICLE
by Chaitali Mohile
The directional move in Central European Distribution Corp. is about to end on negative indicators, so a small bullish pattern may also undergo high volatility.
Position: N/A
Chaitali Mohile
Active trader in the Indian stock markets since 2003 and a full-time writer. Trading is largely based upon technical analysis.
PRINT THIS ARTICLE
TECHNICAL INDICATORS
Bulls In CEDC Are Losing Their Hold
01/24/08 07:38:33 AMby Chaitali Mohile
The directional move in Central European Distribution Corp. is about to end on negative indicators, so a small bullish pattern may also undergo high volatility.
Position: N/A
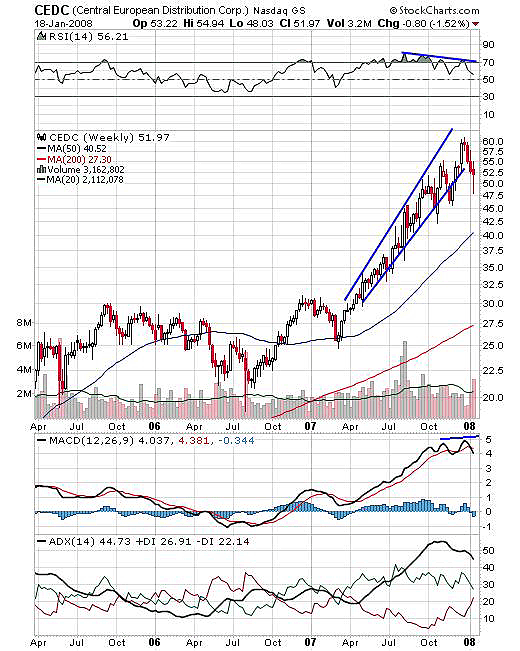
| Central European Distribution Corp. (CEDC) since April 2007 had undergone a strong bullish rally, gaining almost 30 points from the breakout level at around 30. The oscillators were strong so they supported the bullish path of the stock. The trend indicator on moderate buying pressure rallied from a developing to a well-developed uptrend region. The relative strength index (RSI) (14) rose above 50, indicating bullish force in the rally. However, some resistance was seen as RSI (14) crossed the 70 levels (overbought area). The price made a high of $60 on the overbought RSI (14), but by now a negative divergence had started developing between the oscillator and price. |

|
| FIGURE 1: CEDC, WEEKLY. The bullish rally has changed the direction on overheated indicators and negative divergence on RSI (14). |
| Graphic provided by: StockCharts.com. |
| |
| The stock appears to have changed its direction, which would be a good reason to book profits. The average directional movement index (ADX) (14) moved to highly overheated level that is almost above 50, with no increase in buying pressure (+DI). The indicator has declined to 44, but still overheated, and selling pressure (-DI) is showing strength to cross +DI from below. This scenario suggests increased selling pressure, which is another reason to take the profits off the tables. In addition, the moving average convergence/divergence (MACD) (12,26,9) is high in positive territory at 5, forming a double-top pattern and moving below its trigger line. So with this bearish crossover, the price may also slope down. |

|
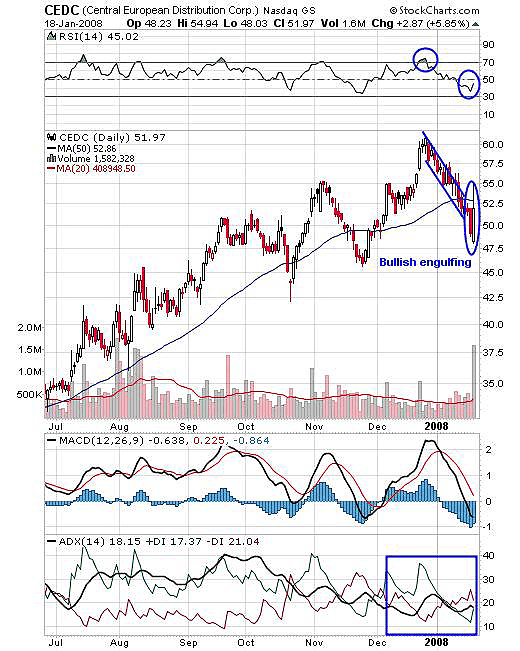
| FIGURE 2: CEDC, DAILY. The price chart shows a bullish engulfing pattern, but indicators are not showing any bullish signs to support a fresh upside rally. |
| Graphic provided by: StockCharts.com. |
| |
| The weekly chart in Figure 1 shows a bearish signal but the daily chart in Figure 2 displays a bullish engulfing pattern. The bullish engulfing is a bullish reversal candlestick pattern that suggests the downtrend will reverse direction. The engulfing pattern has appeared after the stock fell 10 points, and the indicators have lost their strength. The bullish candle has a long upper shadow, which means the stock failed to sustain its high of the day. It also ultimately closed under the pressure of the 50-day moving average. |
| After descending from 70 to 30, the RSI (14) tipped upwards, but the strength in the rally will be confirmed only when it is above the 50 level. The ADX (14) is below 20, which means no trend is built up. It would be best to keep an eye on the -DI movement. The MACD (12,26,9) also moderately shifted to negative territory. And if you look at the big picture, global markets are all going through a bloodbath. |
| So it is probably a good idea to just wait till markets stabilize before entering a long position in this stock. |
Active trader in the Indian stock markets since 2003 and a full-time writer. Trading is largely based upon technical analysis.
| Company: | Independent |
| Address: | C1/3 Parth Indraprasth Towers. Vastrapur |
| Ahmedabad, Guj 380015 | |
| E-mail address: | chaitalimohile@yahoo.co.in |
Traders' Resource Links | |
| Independent has not added any product or service information to TRADERS' RESOURCE. | |
Click here for more information about our publications!
Comments
Date: 01/26/08Rank: 4Comment:

Request Information From Our Sponsors
- StockCharts.com, Inc.
- Candle Patterns
- Candlestick Charting Explained
- Intermarket Technical Analysis
- John Murphy on Chart Analysis
- John Murphy's Chart Pattern Recognition
- John Murphy's Market Message
- MurphyExplainsMarketAnalysis-Intermarket Analysis
- MurphyExplainsMarketAnalysis-Visual Analysis
- StockCharts.com
- Technical Analysis of the Financial Markets
- The Visual Investor
- VectorVest, Inc.
- Executive Premier Workshop
- One-Day Options Course
- OptionsPro
- Retirement Income Workshop
- Sure-Fire Trading Systems (VectorVest, Inc.)
- Trading as a Business Workshop
- VectorVest 7 EOD
- VectorVest 7 RealTime/IntraDay
- VectorVest AutoTester
- VectorVest Educational Services
- VectorVest OnLine
- VectorVest Options Analyzer
- VectorVest ProGraphics v6.0
- VectorVest ProTrader 7
- VectorVest RealTime Derby Tool
- VectorVest Simulator
- VectorVest Variator
- VectorVest Watchdog
