HOT TOPICS LIST
- MACD
- Fibonacci
- RSI
- Gann
- ADXR
- Stochastics
- Volume
- Triangles
- Futures
- Cycles
- Volatility
- ZIGZAG
- MESA
- Retracement
- Aroon
INDICATORS LIST
LIST OF TOPICS
PRINT THIS ARTICLE
by Mike Carr, CMT
A company supporting offshore drilling is breaking down, possibly signaling that lower oil prices lie ahead.
Position: Sell
Mike Carr, CMT
Mike Carr, CMT, is a member of the Market Technicians Association, and editor of the MTA's newsletter, Technically Speaking. He is also the author of "Smarter Investing in Any Economy: The Definitive Guide to Relative Strength Investing," and "Conquering the Divide: How to Use Economic Indicators to Catch Stock Market Trends."
PRINT THIS ARTICLE
BREAKOUTS
Early Sign Of Lower Oil Prices?
01/22/08 12:30:42 PMby Mike Carr, CMT
A company supporting offshore drilling is breaking down, possibly signaling that lower oil prices lie ahead.
Position: Sell
| Bristow Group (BRS) provides helicopter transportation services to the offshore oil and gas industry. Its core business involves flying crews and light cargo to and from production platforms and drilling rigs offshore. The company operates in various offshore exploration and production locations, including the Gulf of Mexico, the North Sea, and Nigeria, as well as in Alaska, Australia, Brazil, Mexico, Russia, and Trinidad. Its stock has been quietly performing very well over the past two years, nearly doubling in price. |
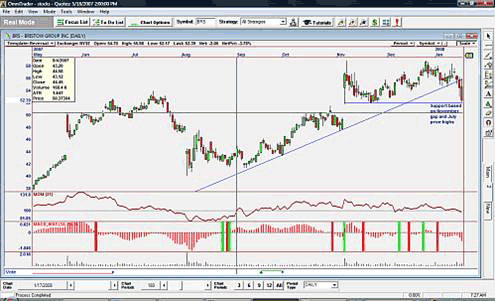
| But this week, BRS showed signs that the long uptrend may be over (Figure 1). Price has fallen below the trendline and is at a support level associated with an upward gap from November and price highs reached in July. Breaking this support will provide traders with conclusive proof that the trend has changed. Looking beyond price, momentum has turned negative, and the moving average convergence/divergence (MACD) is bearish. Volume has been heavier than normal on the recent break in price. |

|
| FIGURE 1: BRS, DAILY. On this chart, BRS has broken a trendline and is testing support. Momentum and MACD are bearish. |
| Graphic provided by: OmniTrader 2008. |
| |
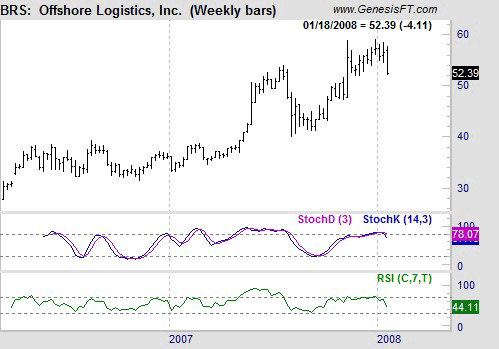
| The weekly chart is equally bearish (Figure 2). Stochastics has turned lower from an extended oversold condition. This indicator action correctly forecast a 20% stock decline last year. The relative strength index (RSI) failed to reach a new high as prices broke to a new high, and this divergence adds to the bearish argument. Neither time frame supports a bullish argument for BRS. |

|
| FIGURE 2: BRS, WEEKLY. This chart of BRS shows stochastics turning lower and the RSI bearishly diverging from price. |
| Graphic provided by: Trade Navigator. |
| |
| Risk on this trade can be limited with a stop at 59. Price advances have been turned back three times from this level. With the market deeply oversold, it is likely to bounce higher in the coming days. BRS represents a great short opportunity during that bounce for traders believing the bear market has further to run or for those seeking a low risk bet on lower oil prices. |
Mike Carr, CMT, is a member of the Market Technicians Association, and editor of the MTA's newsletter, Technically Speaking. He is also the author of "Smarter Investing in Any Economy: The Definitive Guide to Relative Strength Investing," and "Conquering the Divide: How to Use Economic Indicators to Catch Stock Market Trends."
| Website: | www.moneynews.com/blogs/MichaelCarr/id-73 |
| E-mail address: | marketstrategist@gmail.com |
Click here for more information about our publications!
Comments
Date: 01/24/08Rank: 4Comment:

Request Information From Our Sponsors
- StockCharts.com, Inc.
- Candle Patterns
- Candlestick Charting Explained
- Intermarket Technical Analysis
- John Murphy on Chart Analysis
- John Murphy's Chart Pattern Recognition
- John Murphy's Market Message
- MurphyExplainsMarketAnalysis-Intermarket Analysis
- MurphyExplainsMarketAnalysis-Visual Analysis
- StockCharts.com
- Technical Analysis of the Financial Markets
- The Visual Investor
- VectorVest, Inc.
- Executive Premier Workshop
- One-Day Options Course
- OptionsPro
- Retirement Income Workshop
- Sure-Fire Trading Systems (VectorVest, Inc.)
- Trading as a Business Workshop
- VectorVest 7 EOD
- VectorVest 7 RealTime/IntraDay
- VectorVest AutoTester
- VectorVest Educational Services
- VectorVest OnLine
- VectorVest Options Analyzer
- VectorVest ProGraphics v6.0
- VectorVest ProTrader 7
- VectorVest RealTime Derby Tool
- VectorVest Simulator
- VectorVest Variator
- VectorVest Watchdog
