HOT TOPICS LIST
- MACD
- Fibonacci
- RSI
- Gann
- ADXR
- Stochastics
- Volume
- Triangles
- Futures
- Cycles
- Volatility
- ZIGZAG
- MESA
- Retracement
- Aroon
INDICATORS LIST
LIST OF TOPICS
PRINT THIS ARTICLE
by Chaitali Mohile
The index broke away from the descending triangle with a gap down. The Hang Seng Index has immediate support that may prevent further fall, and the breakout may fail.
Position: N/A
Chaitali Mohile
Active trader in the Indian stock markets since 2003 and a full-time writer. Trading is largely based upon technical analysis.
PRINT THIS ARTICLE
DESCENDING TRIANGLES
Hang Seng Makes A Descending Triangle
01/22/08 12:21:19 PMby Chaitali Mohile
The index broke away from the descending triangle with a gap down. The Hang Seng Index has immediate support that may prevent further fall, and the breakout may fail.
Position: N/A
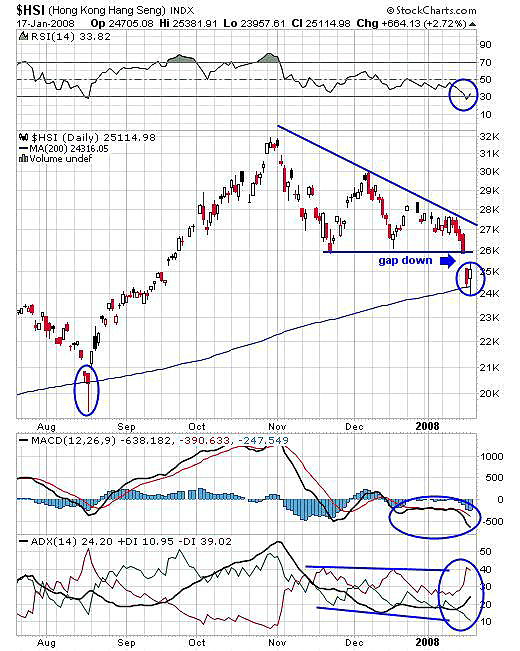
| With reference to my earlier article at Traders.com Advantage about the Hang Seng ($HSI) dated November 9, 2007, with a gap down, a new intermediate downtrend was developed that never turned back. The index has been hammered badly and lost huge amounts of money. The index has formed a descending triangle while going through the correction. A descending triangle is a bearish continuation that appears in a downtrend and indicates distributions. The trendline joining lower highs in Figure 1 is known as a supply line or a sellers' line while the straight horizontal line is called demand line or buyers' line. With a bearish pattern, the breakout happened in a downward direction. Figure 1 shows that the index has already broken below the demand line, which means we can expect more downside. |
| The breakout from the bearish pattern has immediate support of the moving average, which may offer strong support and prevent the index to test lower levels. Earlier, when the index was in a strong uptrend, a bullish rally had started from the same support line. But if history repeats, the upside rally would not be easy for the index. The demand line would be at first resistance and could move in a narrow range as the indicators are bearish too. The average directional movement index (ADX) (14) shows a developing downtrend so surges above the resistance would be difficult. |

|
| FIGURE 1: $HSI, DAILY. A descending triangle breakout may fail due to the 200-day moving average support (the long-term moving average). In addition, the relief rally with this support may see high volatility because of a bearish trend. |
| Graphic provided by: StockCharts.com. |
| |
| The relative strength index (RSI) (14) is suggesting the bullish move with the support of 30, but the rally would accumulate strength only above 50. The moving average convergence/divergence (MACD) (12,26,9) indicates the high volatility even during the recovery. So the breakout of a descending triangle may fail but an upside move would also be volatile. |

|
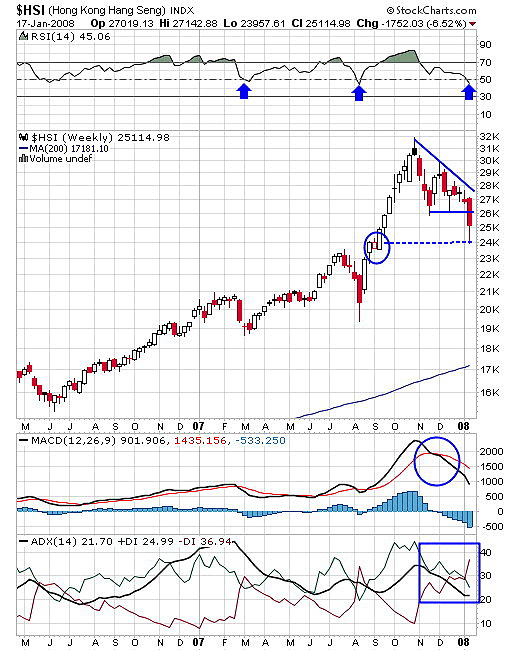
| FIGURE 2: $HSI, WEEKLY. The RSI (14) and MACD (12,26,9) have bullish support that may help the index to recover. But the developing downtrend and bearish sentiments will make the upside rally difficult. |
| Graphic provided by: StockCharts.com. |
| |
| On the weekly chart (Figure 2), the steep descending triangle looks like a right angle. Here, if we look for support after the breakout, then the level of consolidation during the previous uptrend would offer some stability. This support will be an important level for $HSI, but if the support is taken off, the index might enter a serious downtrend. But the possibility of violating this support is very thin, considering the levels of RSI and MACD, while the ADX (14) shows a developing bearish trend. |
| The RSI (14) in Figure 2 had an upward rally from the bullish support at 50 earlier under bullish sentiments. Currently, the indicator has established support at the same level but the situation is different now. This time the index might witness shaky moves while moving in an upside direction. For MACD (12,26,9), there is a bearish crossover in positive territory. So both indicators are currently in bullish areas that might give birth to a volatile pullback, ignoring the descending triangle breakout. |
Active trader in the Indian stock markets since 2003 and a full-time writer. Trading is largely based upon technical analysis.
| Company: | Independent |
| Address: | C1/3 Parth Indraprasth Towers. Vastrapur |
| Ahmedabad, Guj 380015 | |
| E-mail address: | chaitalimohile@yahoo.co.in |
Traders' Resource Links | |
| Independent has not added any product or service information to TRADERS' RESOURCE. | |
Click here for more information about our publications!
Comments
Date: 01/22/08Rank: 3Comment: How is the demand line determined?
Date: 01/24/08Rank: 4Comment:

Request Information From Our Sponsors
- StockCharts.com, Inc.
- Candle Patterns
- Candlestick Charting Explained
- Intermarket Technical Analysis
- John Murphy on Chart Analysis
- John Murphy's Chart Pattern Recognition
- John Murphy's Market Message
- MurphyExplainsMarketAnalysis-Intermarket Analysis
- MurphyExplainsMarketAnalysis-Visual Analysis
- StockCharts.com
- Technical Analysis of the Financial Markets
- The Visual Investor
- VectorVest, Inc.
- Executive Premier Workshop
- One-Day Options Course
- OptionsPro
- Retirement Income Workshop
- Sure-Fire Trading Systems (VectorVest, Inc.)
- Trading as a Business Workshop
- VectorVest 7 EOD
- VectorVest 7 RealTime/IntraDay
- VectorVest AutoTester
- VectorVest Educational Services
- VectorVest OnLine
- VectorVest Options Analyzer
- VectorVest ProGraphics v6.0
- VectorVest ProTrader 7
- VectorVest RealTime Derby Tool
- VectorVest Simulator
- VectorVest Variator
- VectorVest Watchdog
