

HOT TOPICS LIST
- MACD
- Fibonacci
- RSI
- Gann
- ADXR
- Stochastics
- Volume
- Triangles
- Futures
- Cycles
- Volatility
- ZIGZAG
- MESA
- Retracement
- Aroon
INDICATORS LIST
LIST OF TOPICS
PRINT THIS ARTICLE
by Dennis D. Peterson
Bollinger bands are one of the most successful indicators available today.
Position: N/A
Dennis D. Peterson
Market index trading on a daily basis.
PRINT THIS ARTICLE
BOLLINGER BANDS
Bollinger Bands (Part I of IV)
03/09/01 12:09:32 PMby Dennis D. Peterson
Bollinger bands are one of the most successful indicators available today.
Position: N/A
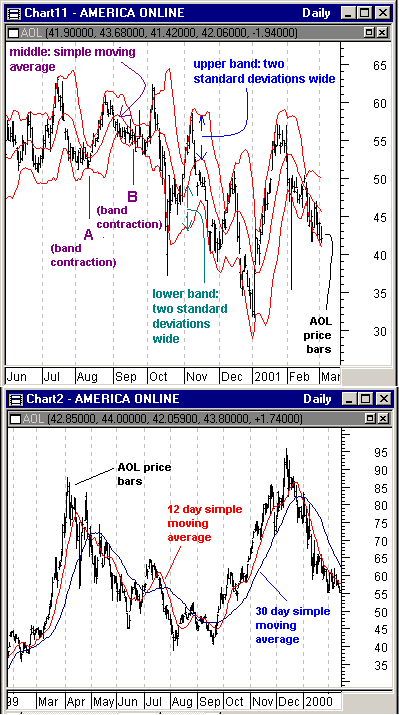
| Several Internet sites offer the popular Bollinger bands as a chart analysis tool. The bands measure volatility and consist of three parts: an upper, middle, and lower band. The middle is a simple moving average. Create the upper band by adding two standard deviations of change to the moving average, and the lower band by subtracting two standard deviations of change to the moving average. I might have said two standard deviations of price, but Bollinger bands can be used to measure more than price volatility alone. In my posting about the thrust oscillator (TO) I used the standard deviation of TO to enhance the performance of the trading system. Why? There are three interesting aspects about Bollinger bands. First, when Bollinger bands contract, as shown by A and B in Figure 1 (upper chart: price chart of AOL), it is often a precursor to a change in direction. If we are measuring price volatility, then it's a change in price direction. Second, Bollinger bands have what are called upper and lower band walkers, seen in Figure 1 (upper chart). When prices move along the upper edge of the upper band they are known as upper band walkers. When prices moving along the lower edge of the lower band, they are referred to as lower band walkers. Upper band walkers indicate increasing values, while lower band walkers indicate decreasing values. Third, there is the overall direction of the bands themselves, either moving up, down, or sideways. Put another way, there is movement within the bands as values change from being upper band walkers to lower band walkers, or vice versa. |
| My first observation, that band contractions are often precursors to change is what I used for TO. Band contractions of volatility are measured by the standard deviation of values. In the case of TO, it is the volatility contraction of TO itself which uses market breadth indicators (advances/declines, up/down volume). Market indexes and stocks go through phases of contraction and expansion. When stocks are going up or down, the continual price change causes the range of values to increase or decrease over a fixed period of time. The price change causes the range to grow over a given period of time. What is perhaps a bit surprising is that volatility contraction is often a precursor to change (I will show this again in Part IV when I look at up and down volume volatility versus Nasdaq composite price change). However, examining A and B in Figure 1 (upper chart), it is hard to believe that it's merely an accident that the bands happened to contract just before the price changed direction. Bollinger bands are used in conjunction with other indicators to monitor the movement of the upper and lower band walkers. So what other indicators do you use? The most common choice on Internet sites is RSI (Relative Strength Index). John Bollinger, the creator of Bollinger bands, recommends RSI, and adds MACD, OBV, and money flow. Band walkers, or tags as Bollinger calls them, will continue to follow along an edge until there is a divergence with another indicator such as RSI, MACD, OBV, or money flow. In other words, the other indicators are used to confirm edge walking. When the other indicators show a change in momentum or interest, the edge walker will often move to the middle or opposite edge. The four choices (RSI, MACD, OBV, and money flow) simply run the gamut when it comes to buying momentum, trend momentum, volume and money direction. |
|
| Figure 1: AOL with Bollinger bands using a 12-day period (upper chart), and AOL with 12-day and 30-day simple moving averages (lower chart). |
| Graphic provided by: MetaStock. |
| Graphic provided by: Data vendor: eSignal<. |
| |
| What variables can affect Bollinger band performance? The first is obviously the number of periods chosen to calculate the volatility and the simple moving average. The default is 20 days. There needs to be a good reason to choose something other than 20. The rule of thumb is to have the simple moving average act as support and resistance, but only for the correction phase after a high or low. I have chosen 12 days because I wanted the simple moving average to act as support after going through a correction from the peak in April 1999, or act as resistance when price moved back up after a bottom, such as the low in Sept. 1999. The lower chart shows both 12-day and 30-day moving averages to contrast their effectiveness in this correction support/resistance role. Because of the volatility of AOL the 30-day moving average is much further away from the price change than the 12-day moving average. Both in August and September the 12-day moving average does a better job at showing a gap up in prices. Another rule you can use in adjusting the period is to see if most of the data is within bands versus all of it. There should be some penetration of the band boundaries. Periods that are too long will encompass such a wide price range as to make the deviations so large that they no longer encompass 95% of the data, but 100%. The other variables to choose are: 1. The indicator to use with Bollinger bands, 2. Whether closing price is the best choice, since you might choose (high + low + close)/3 - sometimes called typical price, and 3. Using Bollinger bands on data other than price. I will cover these subjects in the upcoming articles in this series. |
Market index trading on a daily basis.
| Title: | Staff Writer |
| Company: | Technical Analysis, Inc. |
| Address: | 4757 California Ave SW |
| Seattle, WA 98116-4499 | |
| Phone # for sales: | 206 938 0570 |
| Fax: | 206 938 1307 |
| Website: | www.traders.com |
| E-mail address: | dpeterson@traders.com |
Traders' Resource Links | |
| Charting the Stock Market: The Wyckoff Method -- Books | |
| Working-Money.com -- Online Trading Services | |
| Traders.com Advantage -- Online Trading Services | |
| Technical Analysis of Stocks & Commodities -- Publications and Newsletters | |
| Working Money, at Working-Money.com -- Publications and Newsletters | |
| Traders.com Advantage -- Publications and Newsletters | |
| Professional Traders Starter Kit -- Software | |
Click here for more information about our publications!
Comments
Date:�03/10/01Rank:�5Comment:�appreciate infromation i am new at investing.
Date:�04/21/01Rank:�5Comment:�Daer Sir, Madam,
the article about Bollinger Bands was most interesting for me. But what I am looking for is a trading system for daytrading the Emini S P. Can you give me a hint how to find one? Thank you.
sincerely
Kuurt Gebbert

Request Information From Our Sponsors
- StockCharts.com, Inc.
- Candle Patterns
- Candlestick Charting Explained
- Intermarket Technical Analysis
- John Murphy on Chart Analysis
- John Murphy's Chart Pattern Recognition
- John Murphy's Market Message
- MurphyExplainsMarketAnalysis-Intermarket Analysis
- MurphyExplainsMarketAnalysis-Visual Analysis
- StockCharts.com
- Technical Analysis of the Financial Markets
- The Visual Investor
- VectorVest, Inc.
- Executive Premier Workshop
- One-Day Options Course
- OptionsPro
- Retirement Income Workshop
- Sure-Fire Trading Systems (VectorVest, Inc.)
- Trading as a Business Workshop
- VectorVest 7 EOD
- VectorVest 7 RealTime/IntraDay
- VectorVest AutoTester
- VectorVest Educational Services
- VectorVest OnLine
- VectorVest Options Analyzer
- VectorVest ProGraphics v6.0
- VectorVest ProTrader 7
- VectorVest RealTime Derby Tool
- VectorVest Simulator
- VectorVest Variator
- VectorVest Watchdog