HOT TOPICS LIST
- MACD
- Fibonacci
- RSI
- Gann
- ADXR
- Stochastics
- Volume
- Triangles
- Futures
- Cycles
- Volatility
- ZIGZAG
- MESA
- Retracement
- Aroon
INDICATORS LIST
LIST OF TOPICS
PRINT THIS ARTICLE
by Chaitali Mohile
The airline industry saw bullish days after the bullish reversal candlestick pattern, and Continental is also fueled.
Position: N/A
Chaitali Mohile
Active trader in the Indian stock markets since 2003 and a full-time writer. Trading is largely based upon technical analysis.
PRINT THIS ARTICLE
CANDLESTICK CHARTING
Is Continental Airlines Ready For Take-Off?
01/18/08 12:30:36 PMby Chaitali Mohile
The airline industry saw bullish days after the bullish reversal candlestick pattern, and Continental is also fueled.
Position: N/A
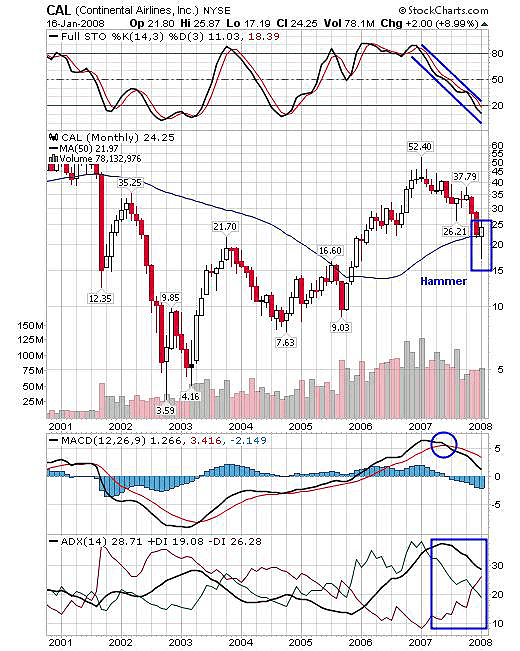
| As you can see on the monthly chart in Figure 1, since early 2007 Continental Airlines (CAL) has been sliding. At the same time the stochastic (14,3,3) was at its highs in the overbought area. Prices declined to 22-23, with a steep fall in stochastics as well. The indicator is oversold below 20 and shows very little space for a down move. Yes, I have a bullish bias here, given that the price chart in Figure 1 has formed a hammer candle, which stands on the support of a 50-day moving average. |

|
| FIGURE 1: CAL, MONTHLY. The hammer candle with a small upper shadow is formed closer to the 50-day moving average support. The ADX (14) and +DI, however, are declining, not having left their bullish levels. Still, the entire move requires a close watch. |
| Graphic provided by: StockCharts.com. |
| |
| The monthly candle seen in Figure 1 is not yet complete, but we cannot underestimate the support beneath. In addition, the hammer is the bullish reversal pattern that ends up in a bearish move. The moving average convergence/divergence (MACD) (12,26,9) is still in the positive zone with a bearish crossover. So the long-term view on CAL remains bullish, with the hammer getting formed and a stochastic turning oversold. The positive directional index (+DI) and the negative directional index (-DI) are moving with equal pace. And the average directional movement index (ADX) (14) has declined below 30, so this needs to be observed carefully. |
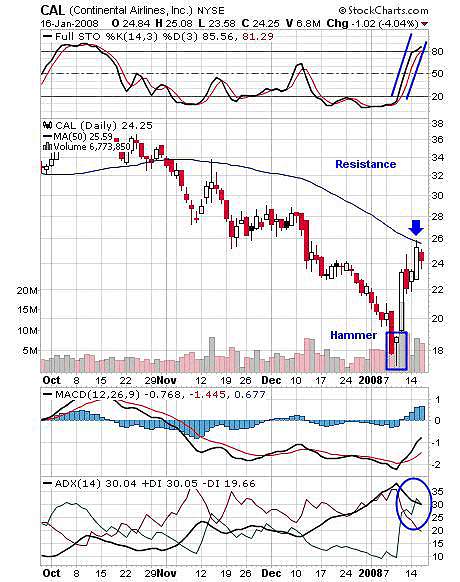
| Figure 2 shows the start of a bullish rally, as the earlier bears were hammered by the candlestick pattern. The hammer appears in a downtrend and indicates a trend reversal. The reaction of the hammer in Figure 2 can be seen by the movement of the stock. CAL moved around $8 in just a week. The stochastic has already crossed 80 from below and therefore is bullish. The MACD (12,26,9) is ready to move ahead of the zero line with a bullish crossover, and the uptrend is developing as the +DI has rushed over the -DI. So here you see the magic of the hammer candle as a single bullish reversal candlestick pattern. Under these bullish conditions, the resistance of the 50-day MA can easily be violated and traders may be surprised. |

|
| FIGURE 2: CAL, DAILY. The hammer at the bottom gave birth to a fresh bullish rally. The indicators are equally bullish to carry the rally ahead. |
| Graphic provided by: StockCharts.com. |
| |
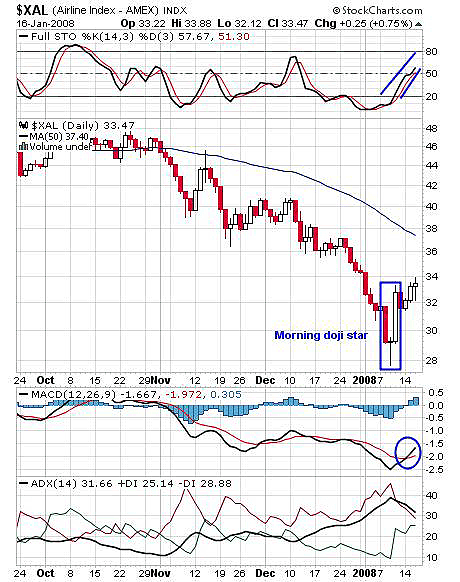
| The airlines index itself has seen some bullish moves in the last few days. The morning doji star initiated the bullish rallies that still have good achievable levels (Figure 3). The morning doji star is also a bullish reversal candlestick pattern, with a doji between the two candles. The upside rally after the reversal pattern has slowed, but the indicators suggest a bullish strength and the trend is changing to up. The ADX (14) has declined to 31 along with -DI, and +DI is ready to surge. The stochastic (14,3,3) has shifted to a bullish zone and MACD (12,26,9) also suggests upside strength. |

|
| FIGURE 3: $XAL, DAILY. The airline index forms a morning doji star, and the indicators show positive signs to maintain the bullish strength that may lead the index to 36–37. |
| Graphic provided by: StockCharts.com. |
| |
| Under the roof of various bullish reversal candlestick patterns formed on all three charts, the airline index bullishness would add the fuel to CAL. |
Active trader in the Indian stock markets since 2003 and a full-time writer. Trading is largely based upon technical analysis.
| Company: | Independent |
| Address: | C1/3 Parth Indraprasth Towers. Vastrapur |
| Ahmedabad, Guj 380015 | |
| E-mail address: | chaitalimohile@yahoo.co.in |
Traders' Resource Links | |
| Independent has not added any product or service information to TRADERS' RESOURCE. | |
Click here for more information about our publications!
Comments
Date: 01/21/08Rank: 4Comment:

Request Information From Our Sponsors
- VectorVest, Inc.
- Executive Premier Workshop
- One-Day Options Course
- OptionsPro
- Retirement Income Workshop
- Sure-Fire Trading Systems (VectorVest, Inc.)
- Trading as a Business Workshop
- VectorVest 7 EOD
- VectorVest 7 RealTime/IntraDay
- VectorVest AutoTester
- VectorVest Educational Services
- VectorVest OnLine
- VectorVest Options Analyzer
- VectorVest ProGraphics v6.0
- VectorVest ProTrader 7
- VectorVest RealTime Derby Tool
- VectorVest Simulator
- VectorVest Variator
- VectorVest Watchdog
- StockCharts.com, Inc.
- Candle Patterns
- Candlestick Charting Explained
- Intermarket Technical Analysis
- John Murphy on Chart Analysis
- John Murphy's Chart Pattern Recognition
- John Murphy's Market Message
- MurphyExplainsMarketAnalysis-Intermarket Analysis
- MurphyExplainsMarketAnalysis-Visual Analysis
- StockCharts.com
- Technical Analysis of the Financial Markets
- The Visual Investor
