

HOT TOPICS LIST
- MACD
- Fibonacci
- RSI
- Gann
- ADXR
- Stochastics
- Volume
- Triangles
- Futures
- Cycles
- Volatility
- ZIGZAG
- MESA
- Retracement
- Aroon
INDICATORS LIST
LIST OF TOPICS
PRINT THIS ARTICLE
by Chaitali Mohile
Yahoo! is back on support, so the bounce may decide whether the formation is a triple bottom.
Position: N/A
Chaitali Mohile
Active trader in the Indian stock markets since 2003 and a full-time writer. Trading is largely based upon technical analysis.
PRINT THIS ARTICLE
TRITOP/TRI BOTTOM
Triple Bottom In Yahoo?
01/17/08 12:19:16 PMby Chaitali Mohile
Yahoo! is back on support, so the bounce may decide whether the formation is a triple bottom.
Position: N/A
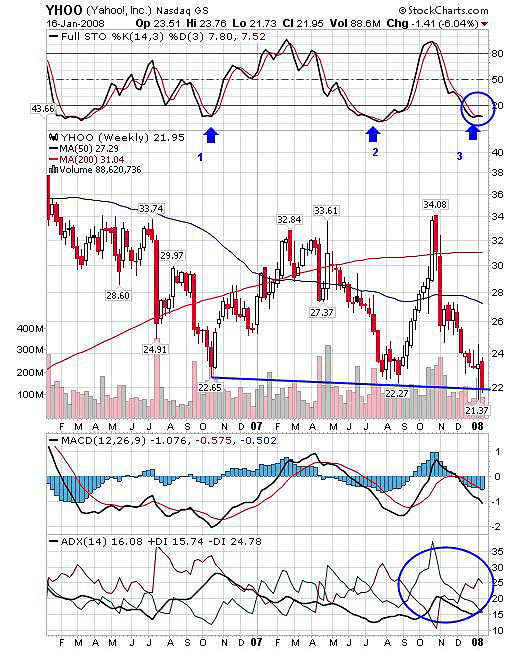
| A triple-bottom formation is a bullish reversal pattern that rarely occurs on charts, so the formation is strong indeed and needs no confirmation. (Refer to my article "1-2-3 Reversal Pattern," in Working Money for trading technique). In October 2006, YHOO established its first support at 22.65. The same support was retested at 22.27 in August 2007. This formed a double bottom and the stock rallied above a 200-day moving average resistance. But due to lack of bullish volume, the stock fell to its nearest support, which was at the 22 level. And there arose the possibility of a triple-bottom formation that suggests a bullish rally could lie ahead. The pattern will be confirmed only if the stock surges back to its previous high of 34.08 and breaks out from there. |
|
| FIGURE 1: YHOO, WEEKLY. The support at 22 is established three times. The upside rally from here, toward the old high of 34.08, would confirm the pattern, and the move above it would be the breakout. |
| Graphic provided by: StockCharts.com. |
| |
| Let's see if the stock has the strength to chase its old high from the support level. The momentum indicators used here would help to sort things out. Like the price chart, the stochastic also shows a triple bottom at oversold levels. The third arrow marked in Figure 1 shows that the indicator is oversold again and may begin its upside journey any time now. This would attract new buying from 22 with the first resistance of 34 as the first target. The average directional movement index (ADX) (14) points to consolidation above the 15 level, and the negative directional index (-DI) is also indicating declining selling strength. So the consolidation would be most likely be in favor of the bulls. |
| The moving average convergence/divergence (MACD) (12,26,9) recently moved into negative territory, so the only bearish indicator is among the other two that may hold back the upside move from the support. The long-term moving average, the 200-day moving average, is above the short-term moving average. This is another bearish pattern on the price chart. The upward price movement would therefore have two resistance levels before it hits the old peak. |
| The support at ~ 22 is established for the third time; some consolidation and global force would add up the strength to pull the stock above the resistance. The triple-bottom formation, however, is strong and needs technical support as well as positive strength from the markets. Currently, the situation is not favorable, so traders should look for more confirmation before initiating a trade. |
Active trader in the Indian stock markets since 2003 and a full-time writer. Trading is largely based upon technical analysis.
| Company: | Independent |
| Address: | C1/3 Parth Indraprasth Towers. Vastrapur |
| Ahmedabad, Guj 380015 | |
| E-mail address: | chaitalimohile@yahoo.co.in |
Traders' Resource Links | |
| Independent has not added any product or service information to TRADERS' RESOURCE. | |
Click here for more information about our publications!
PRINT THIS ARTICLE

Request Information From Our Sponsors
- StockCharts.com, Inc.
- Candle Patterns
- Candlestick Charting Explained
- Intermarket Technical Analysis
- John Murphy on Chart Analysis
- John Murphy's Chart Pattern Recognition
- John Murphy's Market Message
- MurphyExplainsMarketAnalysis-Intermarket Analysis
- MurphyExplainsMarketAnalysis-Visual Analysis
- StockCharts.com
- Technical Analysis of the Financial Markets
- The Visual Investor
- VectorVest, Inc.
- Executive Premier Workshop
- One-Day Options Course
- OptionsPro
- Retirement Income Workshop
- Sure-Fire Trading Systems (VectorVest, Inc.)
- Trading as a Business Workshop
- VectorVest 7 EOD
- VectorVest 7 RealTime/IntraDay
- VectorVest AutoTester
- VectorVest Educational Services
- VectorVest OnLine
- VectorVest Options Analyzer
- VectorVest ProGraphics v6.0
- VectorVest ProTrader 7
- VectorVest RealTime Derby Tool
- VectorVest Simulator
- VectorVest Variator
- VectorVest Watchdog