HOT TOPICS LIST
- MACD
- Fibonacci
- RSI
- Gann
- ADXR
- Stochastics
- Volume
- Triangles
- Futures
- Cycles
- Volatility
- ZIGZAG
- MESA
- Retracement
- Aroon
INDICATORS LIST
LIST OF TOPICS
PRINT THIS ARTICLE
by Mike Carr, CMT
When an analyst upgrades a stock, he or she is usually recognizing a company's improving fundamental conditions. Technicians can take short-term profits from recommendations by digging deeper.
Position: Buy
Mike Carr, CMT
Mike Carr, CMT, is a member of the Market Technicians Association, and editor of the MTA's newsletter, Technically Speaking. He is also the author of "Smarter Investing in Any Economy: The Definitive Guide to Relative Strength Investing," and "Conquering the Divide: How to Use Economic Indicators to Catch Stock Market Trends."
PRINT THIS ARTICLE
POINT & FIGURE
Analyst Upgrades Aren't Always Buy Signals
01/16/08 08:43:57 AMby Mike Carr, CMT
When an analyst upgrades a stock, he or she is usually recognizing a company's improving fundamental conditions. Technicians can take short-term profits from recommendations by digging deeper.
Position: Buy
| Last week, analysts upgraded Amdocs (DOX) and Getty Images (GYI), along with a host of other companies. Lists of upgrades and downgrades are available on many websites and offer the technician an overlooked screening tool. Analysts' reports put the company in the limelight, and many institutional managers looking for actively trading stocks scour the news, hoping to get in ahead of the competition. |
| In this case, both companies have suffered significant declines over the past six months; DOX has lost about a quarter of its value and GYI has lost nearly half. Pattern analysis of their charts is inconclusive, and standard indicators such as the relative strength index (RSI) and the moving average convergence/divergence (MACD) are neutral. Using the regular tools, the technician has no guidance on possible moves by either of these stocks in the news. |
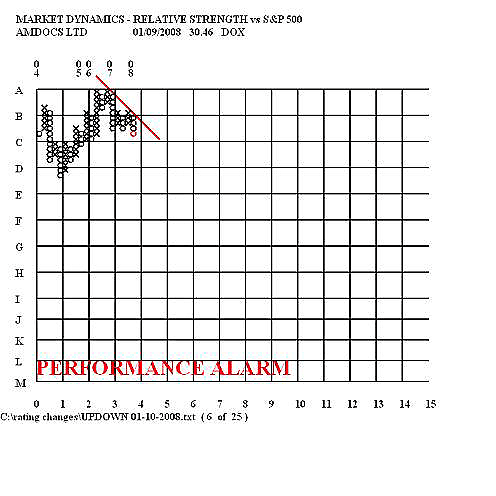
| Relative strength analysis, however, offers a potential clue as to which one is likely to bounce. Looking at relative strength plotted in a point & figure chart removes the day-to-day market noise from the chart and provides a clear picture of the trend. DOX is shown in Figure 1. From this chart we can see that relative strength has just broken out of a small consolidation pattern, is giving a triple bottom sell signal, and is likely to head lower. Price performance of DOX should be expected to lag the market in the intermediate term. |

|
| FIGURE 1: DOX. Amdocs was upgraded at the same time that the stock's relative strength was deteriorating. This stock is unlikely to match the performance of the stock market in the near term. |
| Graphic provided by: Market Dynamics. |
| |
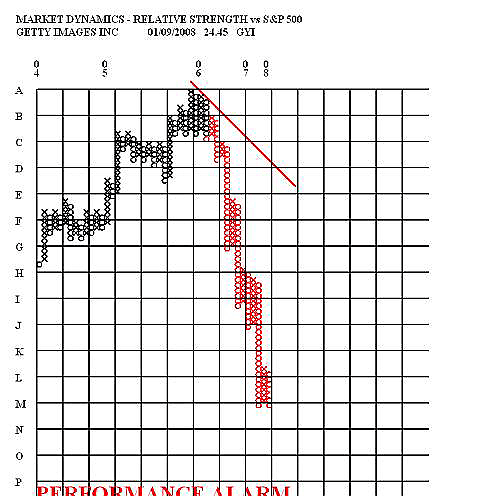
| In contrast, the chart of GYI's relative strength (Figure 2) looks to be severely oversold. It is significantly below its trendline and has shown serious underperformance for nearly two years. Given a choice between the two stocks, GYI is more likely to get an upward bounce from the upgrade based on this chart. It should not be thought of as a long-term hold given this chart, just a quick trade. |

|
| FIGURE 2: GYI. The relative strength of Getty Images is looking very oversold and the stock is likely to get an upward bounce from the announcement of an upgrade. |
| Graphic provided by: Market Dynamics. |
| |
| With the market moving sharply higher the week after the upgrades, GYI outperformed the market, while DOX experienced a small decline. Technicians should consider looking at a listing of analyst upgrades for trading ideas. Finding a strong oversold condition should lead to profitable short-term plays. |
Mike Carr, CMT, is a member of the Market Technicians Association, and editor of the MTA's newsletter, Technically Speaking. He is also the author of "Smarter Investing in Any Economy: The Definitive Guide to Relative Strength Investing," and "Conquering the Divide: How to Use Economic Indicators to Catch Stock Market Trends."
| Website: | www.moneynews.com/blogs/MichaelCarr/id-73 |
| E-mail address: | marketstrategist@gmail.com |
Click here for more information about our publications!
Comments
Date: 01/16/08Rank: 1Comment:
Date: 04/29/08Rank: 5Comment:

Request Information From Our Sponsors
- VectorVest, Inc.
- Executive Premier Workshop
- One-Day Options Course
- OptionsPro
- Retirement Income Workshop
- Sure-Fire Trading Systems (VectorVest, Inc.)
- Trading as a Business Workshop
- VectorVest 7 EOD
- VectorVest 7 RealTime/IntraDay
- VectorVest AutoTester
- VectorVest Educational Services
- VectorVest OnLine
- VectorVest Options Analyzer
- VectorVest ProGraphics v6.0
- VectorVest ProTrader 7
- VectorVest RealTime Derby Tool
- VectorVest Simulator
- VectorVest Variator
- VectorVest Watchdog
- StockCharts.com, Inc.
- Candle Patterns
- Candlestick Charting Explained
- Intermarket Technical Analysis
- John Murphy on Chart Analysis
- John Murphy's Chart Pattern Recognition
- John Murphy's Market Message
- MurphyExplainsMarketAnalysis-Intermarket Analysis
- MurphyExplainsMarketAnalysis-Visual Analysis
- StockCharts.com
- Technical Analysis of the Financial Markets
- The Visual Investor
