HOT TOPICS LIST
- MACD
- Fibonacci
- RSI
- Gann
- ADXR
- Stochastics
- Volume
- Triangles
- Futures
- Cycles
- Volatility
- ZIGZAG
- MESA
- Retracement
- Aroon
INDICATORS LIST
LIST OF TOPICS
PRINT THIS ARTICLE
by Mike Carr, CMT
Over the past year, shares of Apple doubled. With its stock price sitting right at a trendline, this market leader should be watched for clues on the short-term direction of the market.
Position: Buy
Mike Carr, CMT
Mike Carr, CMT, is a member of the Market Technicians Association, and editor of the MTA's newsletter, Technically Speaking. He is also the author of "Smarter Investing in Any Economy: The Definitive Guide to Relative Strength Investing," and "Conquering the Divide: How to Use Economic Indicators to Catch Stock Market Trends."
PRINT THIS ARTICLE
Apple -- A Market Leader At A Critical Level
01/14/08 02:03:36 PMby Mike Carr, CMT
Over the past year, shares of Apple doubled. With its stock price sitting right at a trendline, this market leader should be watched for clues on the short-term direction of the market.
Position: Buy
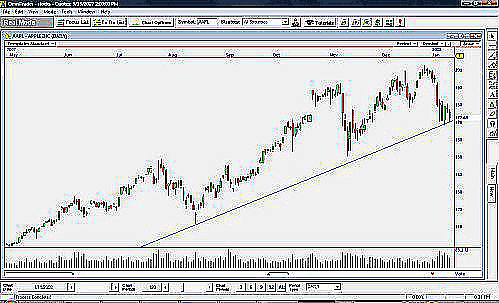
| Apple (AAPL) led the market higher most of last year and withstood the recent downturn with minimal damage. Last week, AAPL successfully tested an up trendline that dates back to August (Figure 1). This is certainly good news for the bulls hoping that the market can find a short-term bottom. The market is unlikely to move higher without support from tech stock leaders such as AAPL. |

|
| FIGURE 1: AAPL. Apple Inc. is testing trendline support and seems to be forming a small base at this level. |
| Graphic provided by: OmniTrader 2008. |
| |
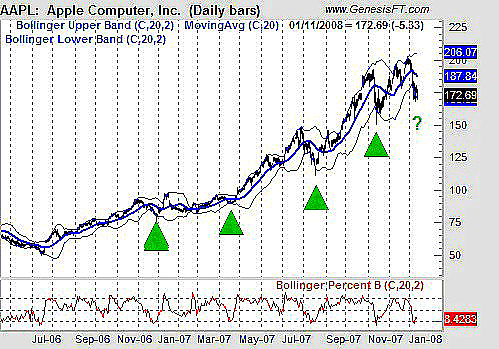
| Bollinger Bands offer a hint that prices may be heading higher from here (Figure 2). The price recently broke below its lower Bollinger Band. This has marked a bottom on four previous occasions and is a reliable indicator that the stock is oversold in the short term. |

|
| FIGURE 2: AAPL, MONTHLY. A test of the lower Bollinger Band has proven to be a reliable buying point in the past for Apple. |
| Graphic provided by: Genesis Trade Navigator. |
| |
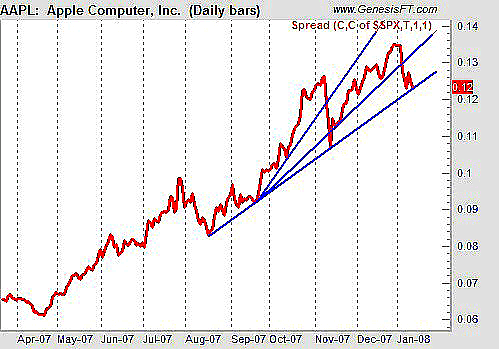
| A troubling sign for AAPL is that its relative strength shows signs of breaking down. The stock's relative strength is charted in Figure 3. This chart shows that relative strength accelerated at an unsustainable pace from the August bottom; it is now at support, just as the price is, and is likely to slow even more before reaching a level of momentum near the long-term line below the current level in Figure 3, which can be maintained. |

|
| FIGURE 3: AAPL, DAILY. The relative strength of Apple is slowing, a possible warning sign for traders with long positions. |
| Graphic provided by: StockCharts.com. |
| Graphic provided by: Trade Navigator. |
| |
| With bullish and bearish signals in place for AAPL, the trader should be cautious. While due for a short-term bounce, the rate of price of change is likely to be slower than in the past, possibly forming a trading range. The important thing to remember is that the next breakout in price will be likely to indicate the direction of the market in coming weeks. |
Mike Carr, CMT, is a member of the Market Technicians Association, and editor of the MTA's newsletter, Technically Speaking. He is also the author of "Smarter Investing in Any Economy: The Definitive Guide to Relative Strength Investing," and "Conquering the Divide: How to Use Economic Indicators to Catch Stock Market Trends."
| Website: | www.moneynews.com/blogs/MichaelCarr/id-73 |
| E-mail address: | marketstrategist@gmail.com |
Click here for more information about our publications!
Comments
Date: 01/15/08Rank: 5Comment:

Request Information From Our Sponsors
- StockCharts.com, Inc.
- Candle Patterns
- Candlestick Charting Explained
- Intermarket Technical Analysis
- John Murphy on Chart Analysis
- John Murphy's Chart Pattern Recognition
- John Murphy's Market Message
- MurphyExplainsMarketAnalysis-Intermarket Analysis
- MurphyExplainsMarketAnalysis-Visual Analysis
- StockCharts.com
- Technical Analysis of the Financial Markets
- The Visual Investor
- VectorVest, Inc.
- Executive Premier Workshop
- One-Day Options Course
- OptionsPro
- Retirement Income Workshop
- Sure-Fire Trading Systems (VectorVest, Inc.)
- Trading as a Business Workshop
- VectorVest 7 EOD
- VectorVest 7 RealTime/IntraDay
- VectorVest AutoTester
- VectorVest Educational Services
- VectorVest OnLine
- VectorVest Options Analyzer
- VectorVest ProGraphics v6.0
- VectorVest ProTrader 7
- VectorVest RealTime Derby Tool
- VectorVest Simulator
- VectorVest Variator
- VectorVest Watchdog
