HOT TOPICS LIST
- MACD
- Fibonacci
- RSI
- Gann
- ADXR
- Stochastics
- Volume
- Triangles
- Futures
- Cycles
- Volatility
- ZIGZAG
- MESA
- Retracement
- Aroon
INDICATORS LIST
LIST OF TOPICS
PRINT THIS ARTICLE
by Kevin Hopson
Bullish patterns on both the short-term and long-term charts could signal much higher prices for TXCO Resources.
Position: Accumulate
Kevin Hopson
Kevin has been a technical analyst for roughly 10 years now. Previously, Kevin owned his own business and acted as a registered investment advisor, specializing in energy. He was also a freelance oil analyst for Orient Trading Co., a commodity futures trading firm in Japan. Kevin is currently a freelance writer.
PRINT THIS ARTICLE
TRIANGLES
Two Bullish Patterns For TXCO Resources
01/14/08 10:21:01 AMby Kevin Hopson
Bullish patterns on both the short-term and long-term charts could signal much higher prices for TXCO Resources.
Position: Accumulate
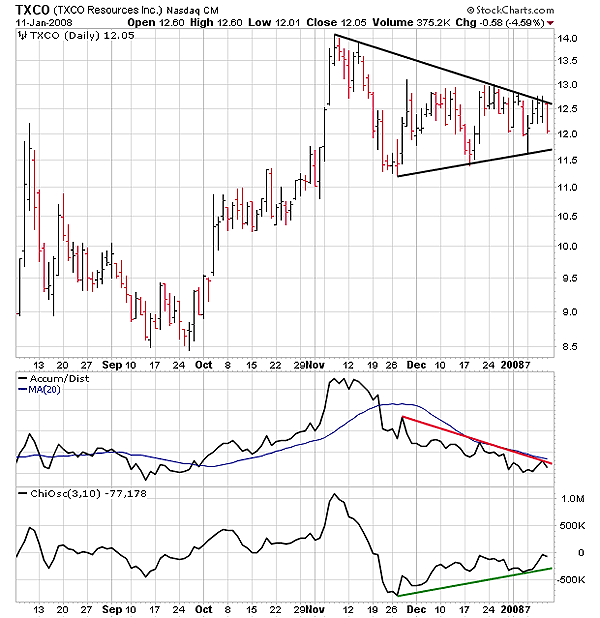
| TXCO Resources is showing bullish patterns on both the short-term and long-term charts. Let us start with the six-month chart (Figure 1). As you can see, TXCO formed a symmetrical triangle after October 2007's sharp runup. Symmetrical triangles tend to be continuation patterns, which means the breakout should be in the same direction as the move prior to the pattern. Since the triangle formed after a substantial rally, the breakout should be to the upside. Right now, if TXCO were to break out, a short-term target of $15.25 would be likely. I calculated this by taking the base of the triangle (high point of $14 minus low point of $11.25 = $2.75) and adding this number to the potential breakout point, which is roughly $12.50. |

|
| FIGURE 1: TXCO, SIX MONTHS. TXCO has formed a symmetrical triangle after October 2007's sharp runup. |
| Graphic provided by: StockCharts.com. |
| |
| You will also note that during the formation of the triangle, the accumulation/distribution (A/D) line has been trending lower. This may appear to be bearish at first glance but if you look at the Chaikin oscillator (money flow), you will see the opposite occurring. This means the stock is seeing a positive divergence in money flow. If the Chaikin oscillator can continue this divergence and move above zero, it will give a buy signal. |
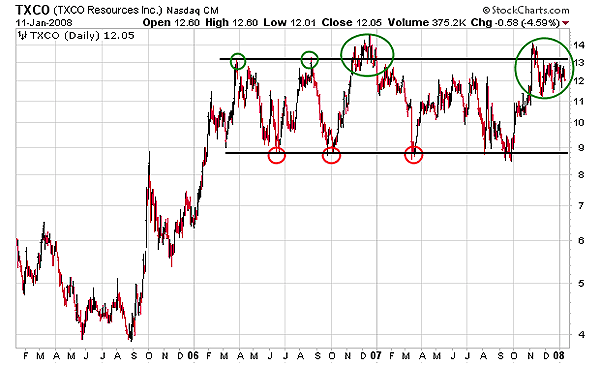
| Meanwhile, the long-term (three-year) chart shows a defined trading range over the past two years (Figure 2). The bottom of the trading range comes into play around $9.00, while the top of the trading range is approximately $13.00 – $14.00. For the purpose of calculating a long-term target, however, we will use $13 as the top of the trading range, the reason being that this price level has been tested the most. Like symmetrical triangles, trading ranges tend to be continuation patterns so the logical break would be to the upside. |

|
| FIGURE 2: TXCO, DAILY. This long-term chart shows a defined trading range over the past two years. |
| Graphic provided by: StockCharts.com. |
| |
| If you count the number of times that prices have tested the top channel line in alternate sequence (as illustrated by the green circles), multiply this figure (4) by the width of the trading range ($13.00 - $9.00 = $4.00) and then add this number (4 x $4.00 = $16.00) to the bottom ($9.00) and top ($13.00) channel lines, you come up with a long-term price target of $25.00 – $29.00. Conservative traders may want to wait for a confirmed breakout from either of these patterns before buying. However, high-risk/high-reward traders should consider accumulating on weakness. |
Kevin has been a technical analyst for roughly 10 years now. Previously, Kevin owned his own business and acted as a registered investment advisor, specializing in energy. He was also a freelance oil analyst for Orient Trading Co., a commodity futures trading firm in Japan. Kevin is currently a freelance writer.
| Glen Allen, VA | |
| E-mail address: | hopson_1@yahoo.com |
Click here for more information about our publications!
Comments
Date: 01/15/08Rank: 5Comment:
Date: 01/25/08Rank: 5Comment:

Request Information From Our Sponsors
- StockCharts.com, Inc.
- Candle Patterns
- Candlestick Charting Explained
- Intermarket Technical Analysis
- John Murphy on Chart Analysis
- John Murphy's Chart Pattern Recognition
- John Murphy's Market Message
- MurphyExplainsMarketAnalysis-Intermarket Analysis
- MurphyExplainsMarketAnalysis-Visual Analysis
- StockCharts.com
- Technical Analysis of the Financial Markets
- The Visual Investor
- VectorVest, Inc.
- Executive Premier Workshop
- One-Day Options Course
- OptionsPro
- Retirement Income Workshop
- Sure-Fire Trading Systems (VectorVest, Inc.)
- Trading as a Business Workshop
- VectorVest 7 EOD
- VectorVest 7 RealTime/IntraDay
- VectorVest AutoTester
- VectorVest Educational Services
- VectorVest OnLine
- VectorVest Options Analyzer
- VectorVest ProGraphics v6.0
- VectorVest ProTrader 7
- VectorVest RealTime Derby Tool
- VectorVest Simulator
- VectorVest Variator
- VectorVest Watchdog
