

HOT TOPICS LIST
- MACD
- Fibonacci
- RSI
- Gann
- ADXR
- Stochastics
- Volume
- Triangles
- Futures
- Cycles
- Volatility
- ZIGZAG
- MESA
- Retracement
- Aroon
INDICATORS LIST
LIST OF TOPICS
PRINT THIS ARTICLE
by Paolo Pezzutti
The stock is attempting a rebound after a long downtrend.
Position: N/A
Paolo Pezzutti
Author of the book "Trading the US Markets - A Comprehensive Guide to US Markets for International Traders and Investors" - Harriman House (July 2008)
PRINT THIS ARTICLE
TECHNICAL ANALYSIS
Texas Instruments Retests Recent Lows
01/11/08 11:39:23 AMby Paolo Pezzutti
The stock is attempting a rebound after a long downtrend.
Position: N/A
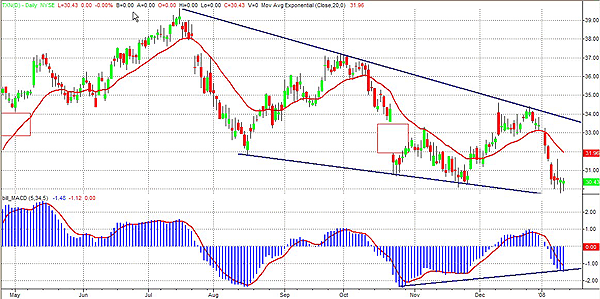
| As you can see in Figure 1, Texas Instruments (TXN) on the daily time frame is moving within a slightly converging down channel. From the relative top printed on July 17, 2007, at $39.63, prices have lost more than 20%. The swings within the channel are wide and the lower trendline has already been tested three times, providing a visual reference of support levels. In Figure 1 I have used the moving average convergence/divergence (MACD). It calculates two exponential moving averages (EMAs) of the lengths specified by the inputs (5 and 34, in this case). The difference between these averages is plotted. This value is then averaged for a specified number of bars (5 in my chart) and then plotted. I find that these parameters provide a good insight of the underlying trend and signal divergences in the momentum of price action. The MACD displays a positive divergence not confirming the recent lows of price printed at the end of November 2007 and at the beginning of 2008. As we all know, divergences do not provide per se an evidence of trend reversal but can alert about the possibility of technical conditions that could trigger at least a rebound. When associated with other elements, they can be useful. In this case, you can see that TXN has just printed a double low retesting the $30 level. This test is quite important to verify the possibility of price to move up toward the upper trendline of the channel at $33.50. The candlestick bars printed on January 9 and 10 are hammers. A hammer forms when the price moves significantly lower after the open but rallies to close well above the intraday low. The resulting candlestick leaves a long stick. It is normally a bullish indication as traders, after a weak start, enter the market aggressively and the stock closes higher for the day. The hammers are printed right at the support level, indicating that this is an important support. |
|
| FIGURE 1: TXN, DAILY. The stock is moving within a downward channel and is retesting recent lows. The MACD displays positive divergences. Two consecutive hammers reinforce the importance of the support. |
| Graphic provided by: TradeStation. |
| |
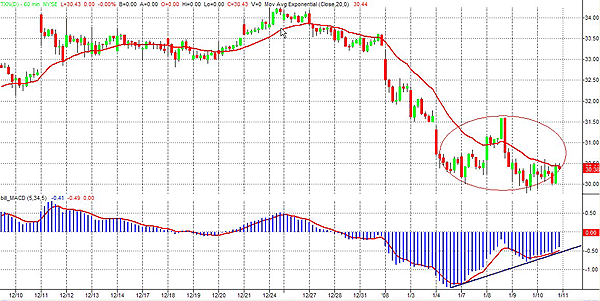
| In Figure 2, you can see the 60-minute chart. After a long downtrend, prices found a support printing a double low associated with a positive divergence of the MACD. The pivot between the two lows is at $31.61. If confirmed, the objective of this pattern would be around the $33 level. Risk is high on this stock. It is inserted within a downward channel, and all we can expect so far is a rebound. The breakout to the downside of the $30 level would negate this scenario. |
|
| FIGURE 2: TXN, DAILY. The retest of the previous has occurred in coincidence with a positive divergence of the MACD. The objective is at $33. A brekout to the downside of the $30 level would negate the formation. |
| Graphic provided by: TradeStation. |
| |
Author of the book "Trading the US Markets - A Comprehensive Guide to US Markets for International Traders and Investors" - Harriman House (July 2008)
| Address: | VIA ROBERTO AGO 26 POSTAL CODE 00166 |
| Rome, ITALY | |
| Phone # for sales: | +393357540708 |
| E-mail address: | pezzutti.paolo@tiscali.it |
Click here for more information about our publications!
Comments
Date:�01/12/08Rank:�3Comment:�

Request Information From Our Sponsors
- VectorVest, Inc.
- Executive Premier Workshop
- One-Day Options Course
- OptionsPro
- Retirement Income Workshop
- Sure-Fire Trading Systems (VectorVest, Inc.)
- Trading as a Business Workshop
- VectorVest 7 EOD
- VectorVest 7 RealTime/IntraDay
- VectorVest AutoTester
- VectorVest Educational Services
- VectorVest OnLine
- VectorVest Options Analyzer
- VectorVest ProGraphics v6.0
- VectorVest ProTrader 7
- VectorVest RealTime Derby Tool
- VectorVest Simulator
- VectorVest Variator
- VectorVest Watchdog
- StockCharts.com, Inc.
- Candle Patterns
- Candlestick Charting Explained
- Intermarket Technical Analysis
- John Murphy on Chart Analysis
- John Murphy's Chart Pattern Recognition
- John Murphy's Market Message
- MurphyExplainsMarketAnalysis-Intermarket Analysis
- MurphyExplainsMarketAnalysis-Visual Analysis
- StockCharts.com
- Technical Analysis of the Financial Markets
- The Visual Investor