HOT TOPICS LIST
- MACD
- Fibonacci
- RSI
- Gann
- ADXR
- Stochastics
- Volume
- Triangles
- Futures
- Cycles
- Volatility
- ZIGZAG
- MESA
- Retracement
- Aroon
INDICATORS LIST
LIST OF TOPICS
PRINT THIS ARTICLE
by Koos van der Merwe
So when will the Dow Jones bottom?
Position: Sell
Koos van der Merwe
Has been a technical analyst since 1969, and has worked as a futures and options trader with First Financial Futures in Johannesburg, South Africa.
PRINT THIS ARTICLE
CYCLES
Yes, The US Is In A Recession
01/11/08 11:23:18 AMby Koos van der Merwe
So when will the Dow Jones bottom?
Position: Sell
| One of the most interesting discoveries in cyclical trading is what J. Welles Wilder has called the delta phenomenon. The cyclical count is mystified and tied to astronomical forces and advertised as being a "hidden order," but in 1975, a man named Roger Paget spent two hours in my office in Pretoria, South Africa, discussing his cyclical observation. The only difference between his cyclical research and that of the delta phenomenon is the inversion, where a rotation of 11 points is always a high point followed by a high point. In Figure 1, the chart of the Dow Jones Industrial Average (DJIA) has only six points, so the inversion theory does not apply. |

|
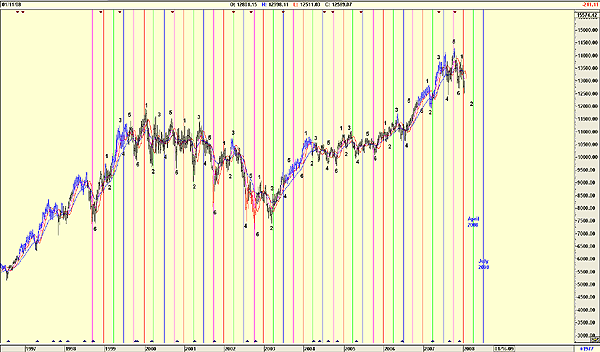
| FIGURE 1: DJIA, WEEKLY. This chart shows major cyclical turning points. |
| Graphic provided by: AdvancedGET. |
| |
| The strategy of Roger Paget, who has since our meeting passed away, was far from astronomical. He had his own system of counting cyclical turning points, and where the delta strategy applies an inversion with varying counts, Paget would invert the chart from that point forward for 40 periods. Sounds simple, but in the days before a computer, that took time, with tracing paper and a 10B soft pencil. In the years that I have used delta, I have found it remarkably accurate. It is not the Holy Grail of trading, but it is one of the best arrows in my cycle-quiver. In this article I shall not discuss the delta phenomenon in depth; that I leave to DeltaSociety.com, but I will present a weekly chart of the DJIA, which is almost self-explanatory. Roger Paget divided a year into four equal parts as shown by the colored vertical lines. The delta phenomenon, on the other hand, divides a year into phases of the full or new moon, which is probably more accurate, but for this chart, we leave it as is. |
| Figure 1 shows the year divided into red, green, blue, and maroon vertical lines, which are then repeated each year. I have divided each year into six turning points as shown. Starting from the red vertical, the start of 1999, I looked for major turning points in the DJIA. I found six and numbered them accordingly. I then projected those turning points forward in approximately the same position between the colored vertical lines. The delta moon points could probably account for a more accurate picture simply because the number of days of a lunar cycle is constant, where a month of days varies between 30 and 31 with February having only 28 days. Note how repetitive the turning points are; for example, "1" is always a high point leaning to the vertical maroon line, while "2" is a low leaning to the green vertical line, and so on. Difficult counts are where no highs or lows occur when the market is extremely bullish or bearish. In this instance, you place the number in the position that is expected of it. |
| Projecting forward for the DJIA therefore, we should look to a low in the DJIA around about April 2008. Gann and Elliott charts will offer an approximate target in price. |
Has been a technical analyst since 1969, and has worked as a futures and options trader with First Financial Futures in Johannesburg, South Africa.
| Address: | 3256 West 24th Ave |
| Vancouver, BC | |
| Phone # for sales: | 6042634214 |
| E-mail address: | petroosp@gmail.com |
Click here for more information about our publications!
Comments
Date: 01/12/08Rank: 1Comment:

Request Information From Our Sponsors
- StockCharts.com, Inc.
- Candle Patterns
- Candlestick Charting Explained
- Intermarket Technical Analysis
- John Murphy on Chart Analysis
- John Murphy's Chart Pattern Recognition
- John Murphy's Market Message
- MurphyExplainsMarketAnalysis-Intermarket Analysis
- MurphyExplainsMarketAnalysis-Visual Analysis
- StockCharts.com
- Technical Analysis of the Financial Markets
- The Visual Investor
- VectorVest, Inc.
- Executive Premier Workshop
- One-Day Options Course
- OptionsPro
- Retirement Income Workshop
- Sure-Fire Trading Systems (VectorVest, Inc.)
- Trading as a Business Workshop
- VectorVest 7 EOD
- VectorVest 7 RealTime/IntraDay
- VectorVest AutoTester
- VectorVest Educational Services
- VectorVest OnLine
- VectorVest Options Analyzer
- VectorVest ProGraphics v6.0
- VectorVest ProTrader 7
- VectorVest RealTime Derby Tool
- VectorVest Simulator
- VectorVest Variator
- VectorVest Watchdog
