HOT TOPICS LIST
- MACD
- Fibonacci
- RSI
- Gann
- ADXR
- Stochastics
- Volume
- Triangles
- Futures
- Cycles
- Volatility
- ZIGZAG
- MESA
- Retracement
- Aroon
INDICATORS LIST
LIST OF TOPICS
PRINT THIS ARTICLE
by Chaitali Mohile
EDU has formed a symmetrical triangle and is trying to break out toward the upside.
Position: Buy
Chaitali Mohile
Active trader in the Indian stock markets since 2003 and a full-time writer. Trading is largely based upon technical analysis.
PRINT THIS ARTICLE
TRIANGLES
New Oriental Education & Technology Group Looks For The Breakout
01/11/08 11:11:43 AMby Chaitali Mohile
EDU has formed a symmetrical triangle and is trying to break out toward the upside.
Position: Buy
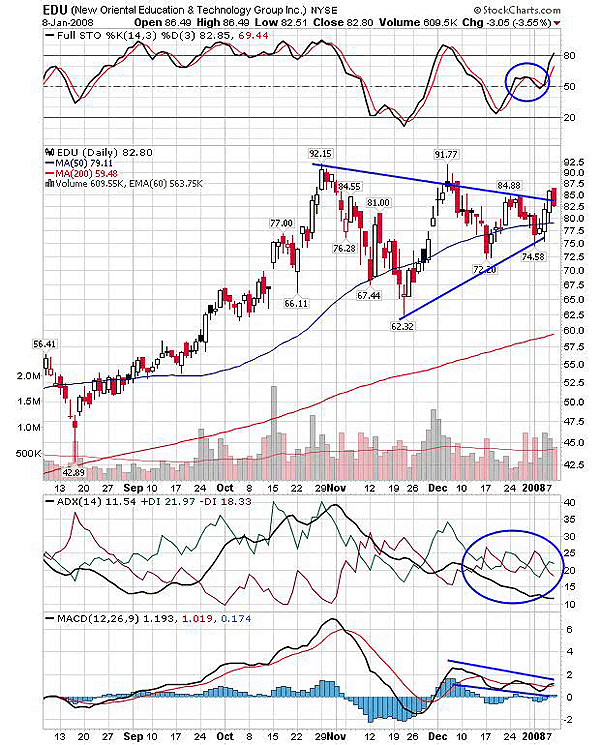
| Amid three specific triangles -- ascending, descending, and symmetrical -- the last is more complicated in terms of breakout direction. We cannot judge the breakout direction for the symmetrical triangle even in strong trends. This triangle can break down in a strong uptrend and vice versa. In Figure 1, New Oriental Education (EDU) has formed a symmetrical triangle after forming lower highs and higher lows for almost two months. The stock is moving in a narrow range as the triangle matures. |
| The stock seemed stronger in the sector in the last few days. The entire financial market was wild, and I think this stock is likely to give a bullish breakout. With the support of a lower trendline, the stock has violated the upper resistance trendline with the bullish support of two momentum indicators. While the stock was moving in a narrow range, the stochastic (14,3,3) has established support at 50 and the moving average convergence/divergence (MACD) (12,26,9) had shaky moves near its trigger line in positive territory. |

|
| FIGURE 1: EDU, DAILY. The stock tries to break out upward from the symmetrical triangle. |
| Graphic provided by: StockCharts.com. |
| |
| With two positive days, the stochastic showed positive momentum in the rally. This may help price move ahead of a fresh support line. The MACD (12,26,9) is about to give a bullish crossover, but you need the confirmation. The indicator is likely to sustain in a positive zone so you can run with the breakout by buying the stock only when it is above 85 and the MACD gives a bullish crossover. So just hold your patience. The only cause of concern is the average directional movement index (ADX) (14). The trend indicator is weak (below 15), and the positive directional index (+DI) and negative directional index (-DI) are tangled, which indicates the possibility of consolidation with some volatility during the rally. |
| The stock should essentially sustain above the upper trendline for a confirmed breakout. The minimum estimated level on the breakout of a symmetrical triangle is known by measuring the length of triangle -- that is, 92.15 - 62.32 = 29.83 + 85 (breakout level) = 114.83 You can take long positions with this target, but I would like to add a word of caution here -- keep a tight stop-loss of 80 (for example, five points) and keep your position half the quantity you usually do. This way you will protect your capital and keep your bank account growing. If the trade is profitable place a trailing stop to protect your profits. |
Active trader in the Indian stock markets since 2003 and a full-time writer. Trading is largely based upon technical analysis.
| Company: | Independent |
| Address: | C1/3 Parth Indraprasth Towers. Vastrapur |
| Ahmedabad, Guj 380015 | |
| E-mail address: | chaitalimohile@yahoo.co.in |
Traders' Resource Links | |
| Independent has not added any product or service information to TRADERS' RESOURCE. | |
Click here for more information about our publications!
Comments
Date: 01/12/08Rank: 4Comment:

Request Information From Our Sponsors
- StockCharts.com, Inc.
- Candle Patterns
- Candlestick Charting Explained
- Intermarket Technical Analysis
- John Murphy on Chart Analysis
- John Murphy's Chart Pattern Recognition
- John Murphy's Market Message
- MurphyExplainsMarketAnalysis-Intermarket Analysis
- MurphyExplainsMarketAnalysis-Visual Analysis
- StockCharts.com
- Technical Analysis of the Financial Markets
- The Visual Investor
- VectorVest, Inc.
- Executive Premier Workshop
- One-Day Options Course
- OptionsPro
- Retirement Income Workshop
- Sure-Fire Trading Systems (VectorVest, Inc.)
- Trading as a Business Workshop
- VectorVest 7 EOD
- VectorVest 7 RealTime/IntraDay
- VectorVest AutoTester
- VectorVest Educational Services
- VectorVest OnLine
- VectorVest Options Analyzer
- VectorVest ProGraphics v6.0
- VectorVest ProTrader 7
- VectorVest RealTime Derby Tool
- VectorVest Simulator
- VectorVest Variator
- VectorVest Watchdog
