HOT TOPICS LIST
- MACD
- Fibonacci
- RSI
- Gann
- ADXR
- Stochastics
- Volume
- Triangles
- Futures
- Cycles
- Volatility
- ZIGZAG
- MESA
- Retracement
- Aroon
INDICATORS LIST
LIST OF TOPICS
PRINT THIS ARTICLE
by Chaitali Mohile
Oracle Corp. retraced back from its 52-week high and filled a previous gap-up opening.
Position: N/A
Chaitali Mohile
Active trader in the Indian stock markets since 2003 and a full-time writer. Trading is largely based upon technical analysis.
PRINT THIS ARTICLE
GAPS
Oracle Makes A U-Turn
01/09/08 12:48:31 PMby Chaitali Mohile
Oracle Corp. retraced back from its 52-week high and filled a previous gap-up opening.
Position: N/A
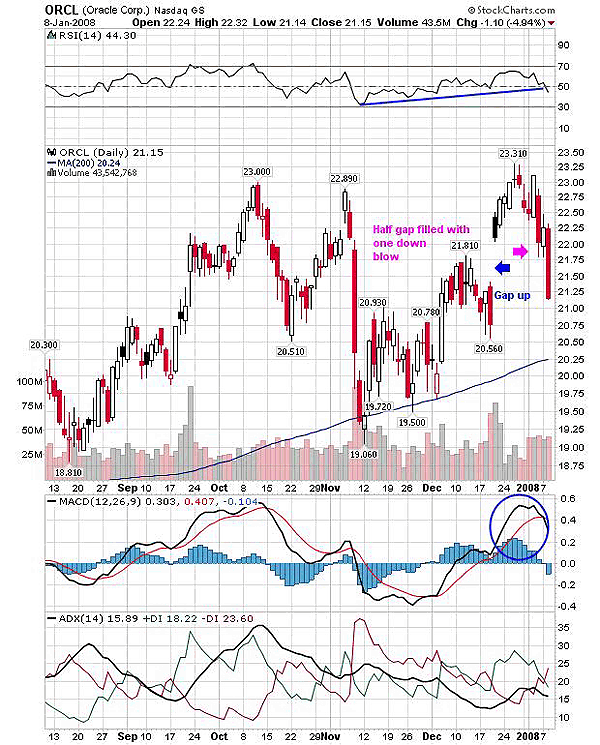
| Oracle Corp. presents the perfect example of the gap-filling theory. With certain gap-up openings, analysts usually mention some trading techniques. One such technique is trading when the gap gets filled, but the time period always presents a challenge. In one such example, in mid-December 2007 the stock gapped up about 1.5 and rallied above 23, marking a new high of 23.310 in the next few days. The stock formed a doji star and then a bearish candle at this level and the relative strength index (RSI) (14) was reluctant to cross 70. The buying pressure as indicated in the average directional movement index (ADX) (14) was not so encouraging on the rally, and in addition, the moving average convergence/divergence (MACD) (12,26,9) shows bearish signs to move below its trigger line. These conditions forced the security to retrace back to the support below. |
| The downside rally filled half the gap in just one day, resting at 21.75. ORCL earlier had resistance at 21.80, which was closer support during the current bearish rally. The second slide filled the gap completely and the stock is now retesting exactly on the previous gap-up level that is 21.25. So this level can be a good buying level in normal market conditions. But today, conditions vary and the stock is not favorable for buying. The indicators have turned bearish and the market is wild. |

|
| FIGURE 1: ORCL, DAILY. The gap is completely filled by consecutive bearish days. The indicators suggest some more downward rally. |
| Graphic provided by: StockCharts.com. |
| |
| The RSI (14) and the MACD (12,26,9) have slipped below their bullish supports. The MACD has a bearish crossover but it is still in positive territory, which means that the positive indication remains. In addition, the ADX (14) is weak. So the bearish pressure continues and the downside rally, even after the gap gets filled, may continue. So traders need to watch where support gets established. |
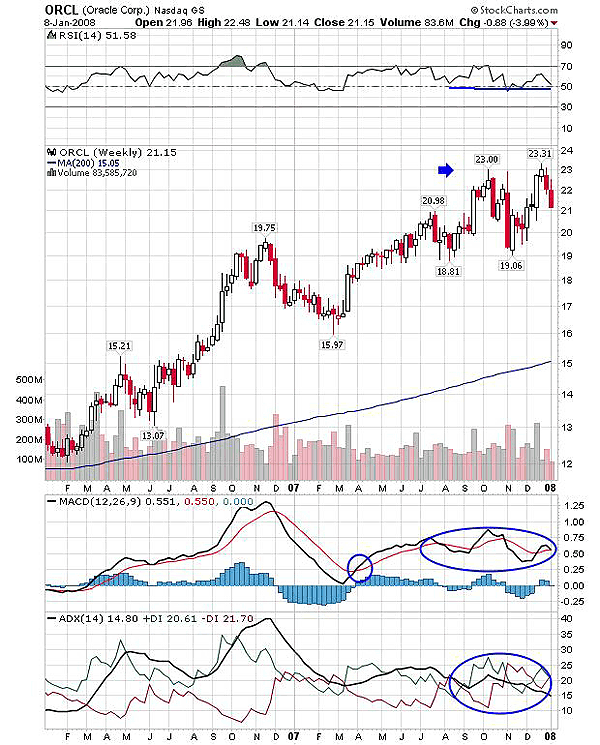
| Figure 2 shows the double-top effect at its 52-week high. As mentioned previously, the stock hit its 52-week high at 23; it then retraced closer to prior support of 18.81. The RSI (14) slipped as well but maintained its bullish support at 50, whereas MACD (12,26,9) showed volatility in the positive zone. Adding up some buying pressure, the stock surged and made a new high at 23.31, and the double top was formed. Eventually, the stock declined, losing about $2. Though the stock has mixed views on indicators, the financial markets have strong bearish pressure. |

|
| FIGURE 2: ORCL, WEEKLY. This chart shows a double-top effect. The traders need to watch out for the next support level. |
| Graphic provided by: StockCharts.com. |
| |
| To find trading opportunities, let the stock establish some support before rallying back to new highs. |
Active trader in the Indian stock markets since 2003 and a full-time writer. Trading is largely based upon technical analysis.
| Company: | Independent |
| Address: | C1/3 Parth Indraprasth Towers. Vastrapur |
| Ahmedabad, Guj 380015 | |
| E-mail address: | chaitalimohile@yahoo.co.in |
Traders' Resource Links | |
| Independent has not added any product or service information to TRADERS' RESOURCE. | |
Click here for more information about our publications!
Comments
Date: 01/09/08Rank: 4Comment:

|

Request Information From Our Sponsors
- StockCharts.com, Inc.
- Candle Patterns
- Candlestick Charting Explained
- Intermarket Technical Analysis
- John Murphy on Chart Analysis
- John Murphy's Chart Pattern Recognition
- John Murphy's Market Message
- MurphyExplainsMarketAnalysis-Intermarket Analysis
- MurphyExplainsMarketAnalysis-Visual Analysis
- StockCharts.com
- Technical Analysis of the Financial Markets
- The Visual Investor
- VectorVest, Inc.
- Executive Premier Workshop
- One-Day Options Course
- OptionsPro
- Retirement Income Workshop
- Sure-Fire Trading Systems (VectorVest, Inc.)
- Trading as a Business Workshop
- VectorVest 7 EOD
- VectorVest 7 RealTime/IntraDay
- VectorVest AutoTester
- VectorVest Educational Services
- VectorVest OnLine
- VectorVest Options Analyzer
- VectorVest ProGraphics v6.0
- VectorVest ProTrader 7
- VectorVest RealTime Derby Tool
- VectorVest Simulator
- VectorVest Variator
- VectorVest Watchdog
