HOT TOPICS LIST
- MACD
- Fibonacci
- RSI
- Gann
- ADXR
- Stochastics
- Volume
- Triangles
- Futures
- Cycles
- Volatility
- ZIGZAG
- MESA
- Retracement
- Aroon
INDICATORS LIST
LIST OF TOPICS
PRINT THIS ARTICLE
by Chaitali Mohile
The index after consistent bearish breakouts is retesting the supports in a strong downtrend.
Position: N/A
Chaitali Mohile
Active trader in the Indian stock markets since 2003 and a full-time writer. Trading is largely based upon technical analysis.
PRINT THIS ARTICLE
BULL/BEAR MARKET
Semiconductor Index Is Losing The Support
01/08/08 11:31:52 AMby Chaitali Mohile
The index after consistent bearish breakouts is retesting the supports in a strong downtrend.
Position: N/A
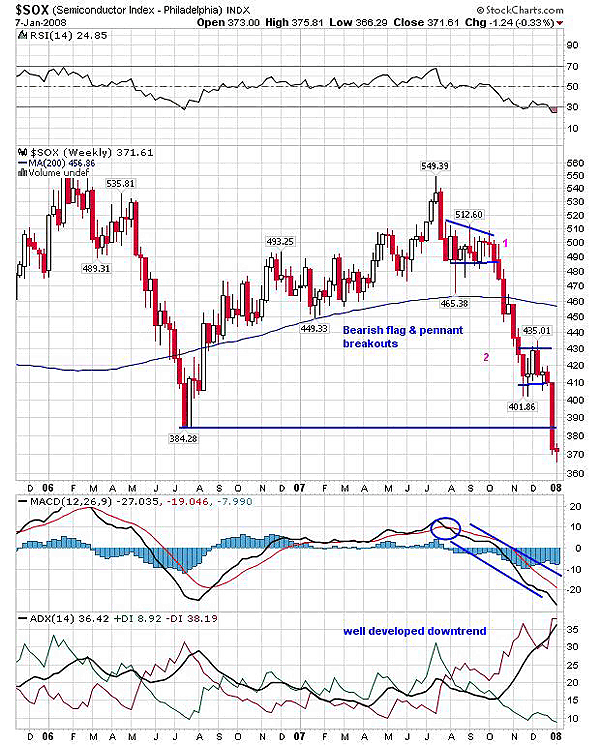
| In prevailing market conditions, the stocks under bearish pressure are more than those in a bullish mood. Similarly, few sectors -- industrial indexes, some major indexes -- are either close to or have violated their nearest support. So now traders can find many bearish patterns on the charts; same is the case of the semiconductor Index. In Figure 1, the weekly chart, the index was at the highest level of 550 in early 2006 before it gradually turned lower to 384 by mid-2006. The moving average convergence/divergence (MACD) (12,26,9) moved to positive territory but showed some fresh volatility coming in. In addition, the average directional movement index (ADX) that declined to 15 established the support and tried to move upward with weak buying pressure. As result, the index took longer to recover to its previous high of 550. |

|
| FIGURE 1: $SOX, WEEKLY. After two bearish flag & pennant breakouts, the RSI (14) reached an oversold area, the MACD (12,26,9) is deeply negative, and the ADX (14) shows a well-developed downtrend. |
| Graphic provided by: StockCharts.com. |
| |
| Under this weak bullish strength, the index failed to climb above the prior high and began its downside journey. After the first bearish flag & pennant formation the index dropped below its 200-day moving average support. This was the first bearish signal. Then was the second lower consolidation in the range ~ 430-410. Meanwhile, the weak indicators turned weaker, and bears became stronger. |
| The ADX (14) crossed 20 with selling pressure so the downtrend was developing here. The MACD (12,26,9) also gave a bearish crossover and rallied below its zero line. The relative strength index (RSI) (14) that hardly touched 70 had a nosedive to 30. The entire picture is highly bearish now. No wonder the breakdown from the second bearish flag & pennant saw the index move below the previous low pivot of 384. The possibility of a pullback in $SOX is very dull under the present volatility in the entire global market. |

|
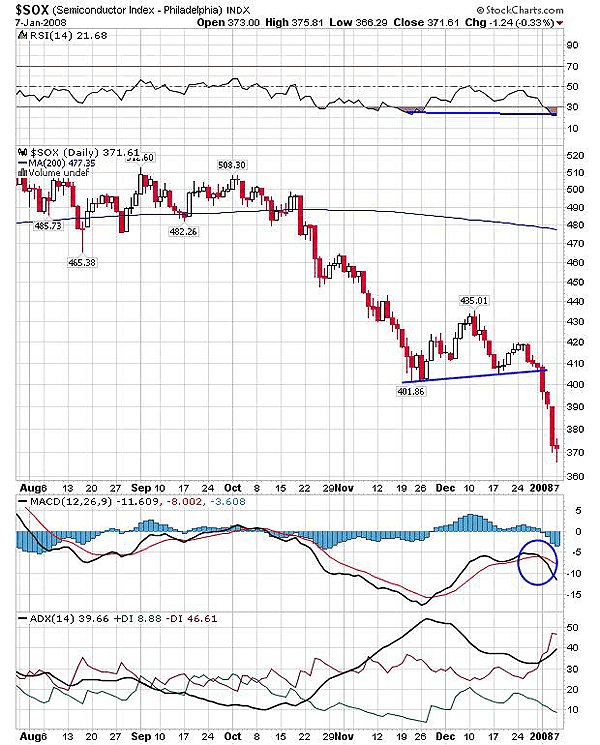
| FIGURE 2: $SOX, DAILY. The index has lost its support of 380 and the indicators are highly bearish, therefore leaving no space for bulls to come back. |
| Graphic provided by: StockCharts.com. |
| |
| On the daily chart (Figure 2), the index was consolidating with the support of a 200-day moving average with the RSI (14) finding it difficult to move above 50, and the MACD (12,26,9) showed no fixed direction to rally. In addition, -DI and +DI moved at an equal pace with a weak ADX (14) that tested 10. The situation therefore was not favorable for bullish breakout. The downward breakouts resulted in a huge plunge, losing almost 90 points in a month and a half. The bears continued their rally even below the lower consolidation in the range of 430-410. |
| The ADX (14) shows a well-developed downtrend. The MACD (12,26,9) has a bearish crossover in the negative territory. In addition, the RSI (14) is oversold at 20 levels; this indicates that the indicator still has room left below. And the RSI can remain oversold or overbought for longer so an overall scenario shows no signs for bulls. Therefore, the bears are likely to continue in the semiconductor index. As a result, the support even below 370 is likely to get tested. |
Active trader in the Indian stock markets since 2003 and a full-time writer. Trading is largely based upon technical analysis.
| Company: | Independent |
| Address: | C1/3 Parth Indraprasth Towers. Vastrapur |
| Ahmedabad, Guj 380015 | |
| E-mail address: | chaitalimohile@yahoo.co.in |
Traders' Resource Links | |
| Independent has not added any product or service information to TRADERS' RESOURCE. | |
Click here for more information about our publications!
Comments
Date: 01/09/08Rank: 4Comment:

Request Information From Our Sponsors
- StockCharts.com, Inc.
- Candle Patterns
- Candlestick Charting Explained
- Intermarket Technical Analysis
- John Murphy on Chart Analysis
- John Murphy's Chart Pattern Recognition
- John Murphy's Market Message
- MurphyExplainsMarketAnalysis-Intermarket Analysis
- MurphyExplainsMarketAnalysis-Visual Analysis
- StockCharts.com
- Technical Analysis of the Financial Markets
- The Visual Investor
- VectorVest, Inc.
- Executive Premier Workshop
- One-Day Options Course
- OptionsPro
- Retirement Income Workshop
- Sure-Fire Trading Systems (VectorVest, Inc.)
- Trading as a Business Workshop
- VectorVest 7 EOD
- VectorVest 7 RealTime/IntraDay
- VectorVest AutoTester
- VectorVest Educational Services
- VectorVest OnLine
- VectorVest Options Analyzer
- VectorVest ProGraphics v6.0
- VectorVest ProTrader 7
- VectorVest RealTime Derby Tool
- VectorVest Simulator
- VectorVest Variator
- VectorVest Watchdog
