HOT TOPICS LIST
- MACD
- Fibonacci
- RSI
- Gann
- ADXR
- Stochastics
- Volume
- Triangles
- Futures
- Cycles
- Volatility
- ZIGZAG
- MESA
- Retracement
- Aroon
INDICATORS LIST
LIST OF TOPICS
PRINT THIS ARTICLE
by Gary Grosschadl
The Dow Jones Industrial Average is not reflecting a happy new year. Here's why.
Position: Sell
Gary Grosschadl
Independent Canadian equities trader and technical analyst based in Peterborough
Ontario, Canada.
PRINT THIS ARTICLE
FIBONACCI
Dow's Dangerous Doji
01/08/08 08:47:40 AMby Gary Grosschadl
The Dow Jones Industrial Average is not reflecting a happy new year. Here's why.
Position: Sell
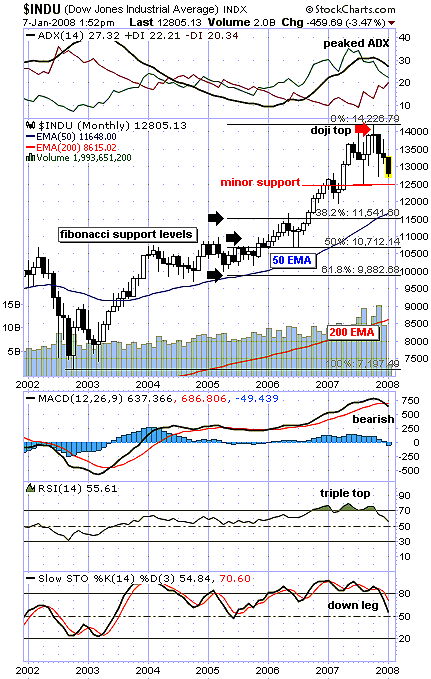
| As the main indexes are off to a shaky start in the new year, let's take a look at a long-term chart for some direction. In Figure 1, this long-term monthly chart shows a potential top in the form of a long-legged doji. Any doji (normally a small cross indicating the same open and close) at a possible top or bottom often points to a strong reversal signal. This form of market hesitation usually points to a shift in momentum, in this case a shift to bearishness. This harbinger to a possible serious down leg was verified by a close below the doji in the next two months. Note the current candlestick is an interim one as the month just started, but it is a bearish start so far. |
| To ponder on where a down leg might go, we should plot on Fibonacci retracement levels. The most common levels are retracements to 38.2%, 50%, and 61.8%. If minor support at 12,500 does not hold, these Fibonacci levels likely come into play. Note how the 38.2% level coincides with the 50-period exponential moving average (EMA) (currently 11,648) giving this level more credence. Should this level be breached, observe how the 50% level coincides with the long-legged tweezer-like bottom of the 2006 brief retracement. Note how even a large retracement to 61.8% still would have a 200-day EMA support, meaning the ultra long-term view holds that the bull is still intact. Most traders, however, would prefer not to suffer such a potentially large correction without taking some defensive action. |

|
| FIGURE 1: $INDU, MONTHLY. The Dow Jones Industrial Average shows possible retracement levels should the bears prevail. |
| Graphic provided by: StockCharts.com. |
| |
| Several indicators are displayed. At the top of the chart, the ADX (average directional movement index) has peaked and is coming down. This portends a shift toward bearish power. This would be confirmed with a crossover of the DI's (directional indicators), which looks soon to occur. The moving average convergence/divergence (MACD) has just bearishly crossed and this would be a major signal if it holds with a January monthly close below 13,000. The relative strength index (RSI) shows a topping pattern of its own in the form of a triple top. Meanwhile, the stochastic oscillator shows a down leg under way now that the 80 level is broken to the downside. |
| In summary, a doji top means a significant reversal could be shaping up. If minor support at 12,500 does not hold, expect a move to at least near 11,500. Failure there brings the bigger Fibonacci levels into play. |
Independent Canadian equities trader and technical analyst based in Peterborough
Ontario, Canada.
| Website: | www.whatsonsale.ca/financial.html |
| E-mail address: | gwg7@sympatico.ca |
Click here for more information about our publications!
Comments
Date: 01/09/08Rank: 3Comment:
Date: 01/10/08Rank: 5Comment:
Date: 01/15/08Rank: 5Comment:
Date: 01/15/08Rank: 5Comment:

|

Request Information From Our Sponsors
- StockCharts.com, Inc.
- Candle Patterns
- Candlestick Charting Explained
- Intermarket Technical Analysis
- John Murphy on Chart Analysis
- John Murphy's Chart Pattern Recognition
- John Murphy's Market Message
- MurphyExplainsMarketAnalysis-Intermarket Analysis
- MurphyExplainsMarketAnalysis-Visual Analysis
- StockCharts.com
- Technical Analysis of the Financial Markets
- The Visual Investor
- VectorVest, Inc.
- Executive Premier Workshop
- One-Day Options Course
- OptionsPro
- Retirement Income Workshop
- Sure-Fire Trading Systems (VectorVest, Inc.)
- Trading as a Business Workshop
- VectorVest 7 EOD
- VectorVest 7 RealTime/IntraDay
- VectorVest AutoTester
- VectorVest Educational Services
- VectorVest OnLine
- VectorVest Options Analyzer
- VectorVest ProGraphics v6.0
- VectorVest ProTrader 7
- VectorVest RealTime Derby Tool
- VectorVest Simulator
- VectorVest Variator
- VectorVest Watchdog
