

HOT TOPICS LIST
- MACD
- Fibonacci
- RSI
- Gann
- ADXR
- Stochastics
- Volume
- Triangles
- Futures
- Cycles
- Volatility
- ZIGZAG
- MESA
- Retracement
- Aroon
INDICATORS LIST
LIST OF TOPICS
PRINT THIS ARTICLE
by Paolo Pezzutti
Weak December sales and sinking stock prices close the year for the US automaker.
Position: N/A
Paolo Pezzutti
Author of the book "Trading the US Markets - A Comprehensive Guide to US Markets for International Traders and Investors" - Harriman House (July 2008)
PRINT THIS ARTICLE
TECHNICAL ANALYSIS
General Motors Keeps Going Down
01/04/08 01:43:33 PMby Paolo Pezzutti
Weak December sales and sinking stock prices close the year for the US automaker.
Position: N/A
| December 2007 sales confirmed the difficult conditions of the automobile industry in the US, in particular, those of General Motors (GM). GM wrapped up 2007 with another month of US sales declines, ending a terrible year for the automaker. For all of 2007, GM recorded a 6% drop in US sales to 3.82 million vehicles. The consumer slowdown, soaring oil prices, and tough competition had a disastrous effect on the auto sector. These seem like excuses, however, when looking at Toyota, which ended the year with US sales of 2.62 million vehicles, a 2% rise from a year earlier. When assessing future prospects, analysts are divided. Both Ford and GM in the US are undergoing multiyear restructuring programs to better position themselves to compete and the economic environment is expected to remain challenging in 2008. If you look at the market's assessment of the situation of General Motors, you would conclude that there is pessimism all around the automaker giant. |
|
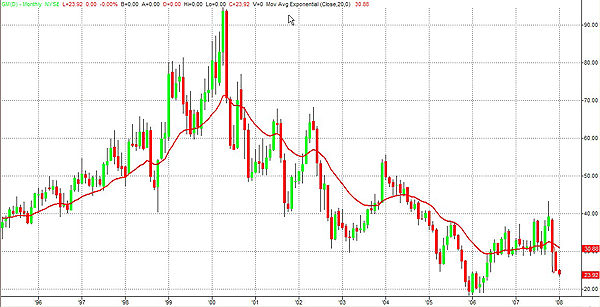
| FIGURE 1: GM, MONTHLY. Prices are approaching the support levels once more. |
| Graphic provided by: TradeStation. |
| |
| Figure 1, the monthly chart, displays how far GM is from the high of $94 back in 2000. Prices are again approaching the $18.50 level hit in 2006, the lowest level in a decade. |
|
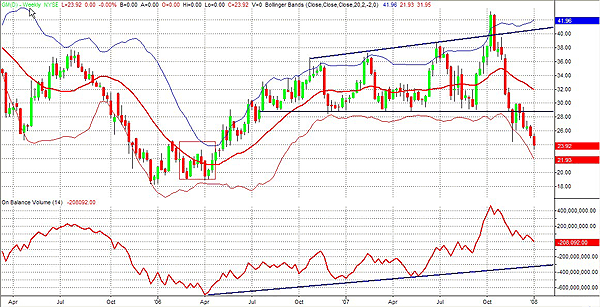
| FIGURE 2: GM, WEEKLY. Bollinger Bands are opening, indicating that an impulse is ongoing. |
| Graphic provided by: TradeStation. |
| |
| In Figure 2, you can see the weekly chart. In the spring of 2006, the stock hit not only a low of price but also of volatility. The Bollinger Bands, in fact, were very narrow. Bollinger Bands are a technical trading tool created by John Bollinger from the need to build adaptive trading bands and reflect the observation that volatility was dynamic. These bands consist of a set of three curves. The middle band measures the trend. Usually, it is a moving average that is used as base for the upper and lower bands. The distance between the upper and lower bands and the middle band is determined by volatility. The default parameters that you may find in most charting software are: Middle Bollinger Band = 20-period simple moving average Upper Bollinger Band = Middle Bollinger Band + 2 * 20-period standard deviation Lower Bollinger Band = Middle Bollinger Band - 2 * 20-period standard deviation As you can see, after the breakout in volatility, prices managed to developed a nice uptrend to reach the $43 level in October 2007. The on-balance volume (OBV) managed to increase its value, indicating that the stock has been accumulated in the past two years. The OBV provides a running total of volume and shows whether this volume is flowing in or out of a given security. Since then, prices have lost more than 40%. It should be noted not just that the Bollinger Bands are opening indicating that an impulse is ongoing; prices have already touched the lower band once and following it to the downside. |
|
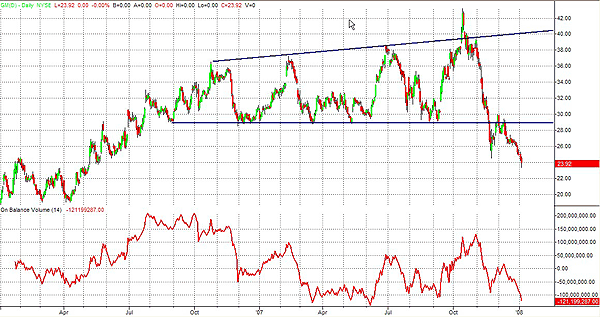
| FIGURE 3: GM, DAILY. The stock printed a breakout of a broadening formation developed during the past year. |
| Graphic provided by: TradeStation. |
| |
| Limiting the analysis at the daily level, in Figure 3 you can see that GM has developed a broadening formation. The formation is an unusual variation of a triangle. It is an inverted triangle or a triangle turned backward. Triangles are characterized by converging trendlines. The broadening formation is the opposite. In the broadening formation, the trendlines diverge. The broadening formation is formed by price swings that are increasingly widening. The base of the formation is at the level of $29. Normally, broadening formations are characterized by high public participation. The breakout generates high volatility as the public indecision and change of attitude are finally addressed at the same time in a directional and volatile move. After a false breakout to the upside of the formation, prices moved fast to below the support level in November 2007. The retest of the $29-30 level failed at the end of November, and since then, prices have developed an impressive downtrend. The OBV is very close to its support, but it has not confirmed; so far, the price is indicative of new lows. |
|
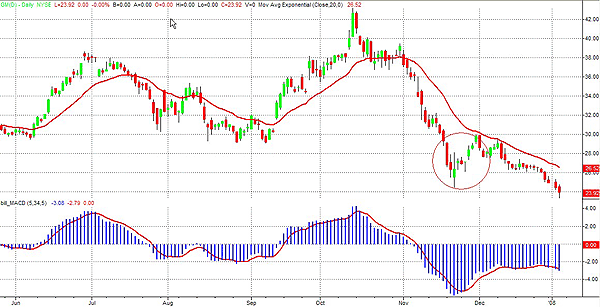
| FIGURE 4: GM, DAILY. The stock has printed seven consecutive down closes and is accelerating to the downside. |
| Graphic provided by: TradeStation. |
| |
| In Figure 4, you can see that following the low printed on November 21, prices have developed a weak reaction. Since the beginning of December, prices have lost more than 20%. What is really impressive is that GM has developed seven consecutive down closes. The situation must be followed very carefully. It is true that the MACD is developing a positive divergence and the OBV is not providing very negative information. But at the moment, I do not see any element that indicates a reversal of the trend. Opening a long position is very risky, as the stock is very volatile. It seems that prices are about to develop a parabolic acceleration of the downtrend that would end with a climax in volatility and a spike. If you are risk-averse, stay away from this stock. If you like risk and you look for good risk/reward ratios to open a trade, I would wait for a specific high-probability reversal pattern. |
Author of the book "Trading the US Markets - A Comprehensive Guide to US Markets for International Traders and Investors" - Harriman House (July 2008)
| Address: | VIA ROBERTO AGO 26 POSTAL CODE 00166 |
| Rome, ITALY | |
| Phone # for sales: | +393357540708 |
| E-mail address: | pezzutti.paolo@tiscali.it |
Click here for more information about our publications!
Comments
Date:�01/04/08Rank:�2Comment:�

Request Information From Our Sponsors
- StockCharts.com, Inc.
- Candle Patterns
- Candlestick Charting Explained
- Intermarket Technical Analysis
- John Murphy on Chart Analysis
- John Murphy's Chart Pattern Recognition
- John Murphy's Market Message
- MurphyExplainsMarketAnalysis-Intermarket Analysis
- MurphyExplainsMarketAnalysis-Visual Analysis
- StockCharts.com
- Technical Analysis of the Financial Markets
- The Visual Investor
- VectorVest, Inc.
- Executive Premier Workshop
- One-Day Options Course
- OptionsPro
- Retirement Income Workshop
- Sure-Fire Trading Systems (VectorVest, Inc.)
- Trading as a Business Workshop
- VectorVest 7 EOD
- VectorVest 7 RealTime/IntraDay
- VectorVest AutoTester
- VectorVest Educational Services
- VectorVest OnLine
- VectorVest Options Analyzer
- VectorVest ProGraphics v6.0
- VectorVest ProTrader 7
- VectorVest RealTime Derby Tool
- VectorVest Simulator
- VectorVest Variator
- VectorVest Watchdog