HOT TOPICS LIST
- MACD
- Fibonacci
- RSI
- Gann
- ADXR
- Stochastics
- Volume
- Triangles
- Futures
- Cycles
- Volatility
- ZIGZAG
- MESA
- Retracement
- Aroon
INDICATORS LIST
LIST OF TOPICS
PRINT THIS ARTICLE
by Chaitali Mohile
With the effect of a double-top formation, Home Depot continues to fall, and the downtrend has become stronger.
Position: N/A
Chaitali Mohile
Active trader in the Indian stock markets since 2003 and a full-time writer. Trading is largely based upon technical analysis.
PRINT THIS ARTICLE
DECLINING TREND
Home Depot Continues Downtrend
01/04/08 01:12:52 PMby Chaitali Mohile
With the effect of a double-top formation, Home Depot continues to fall, and the downtrend has become stronger.
Position: N/A
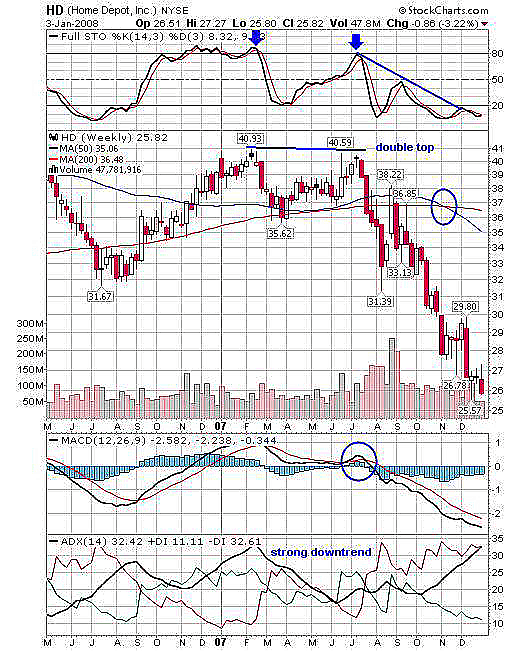
| In Figure 1, Home Depot (HD) formed a double top at ~40 levels in a time span of four to five months. A double top indicates topping out of the stock and is a bearish reversal pattern suggesting the end to an upside rally. The valley between the two peaks is at 35 with the support of two moving averages. The pattern is confirmed when the price violates the support level and the major trend reversal begins. A similar movement can be seen in Figure 1. HD rushed below the support and saw a low of 31.39. At this point, the stock went through a weak pullback as the stochastic (14,3,3) failed to move ahead to the 50 levels. So the stock resumed its downside move, but the worst came in when another strong bearish signal appeared when a long-term moving average (the 200-day MA) crossed a short-term moving average (the 50-day MA) from below. |

|
| FIGURE 1: HOME DEPOT, WEEKLY. The stochastic formed a double top along with the price and started to decline. As a bearish moving average crossover occurred, the price plunged. |
| Graphic provided by: StockCharts.com. |
| |
| With this bearish crossover, the stock tumbled like a house of cards and the series of lower lows continued thereafter. The stochastic (14,3,3) also behaved similarly, forming lower highs and resting in an oversold area below 20. Though currently the indicator is highly oversold, we cannot look for any long position until the indicator actually moves above 20. The moving average convergence/divergence (MACD) (12,26,9) is very negative and has moved deep into negative territory. The average directional movement index (ADX)(14) shows a well-developed downtrend. |

|
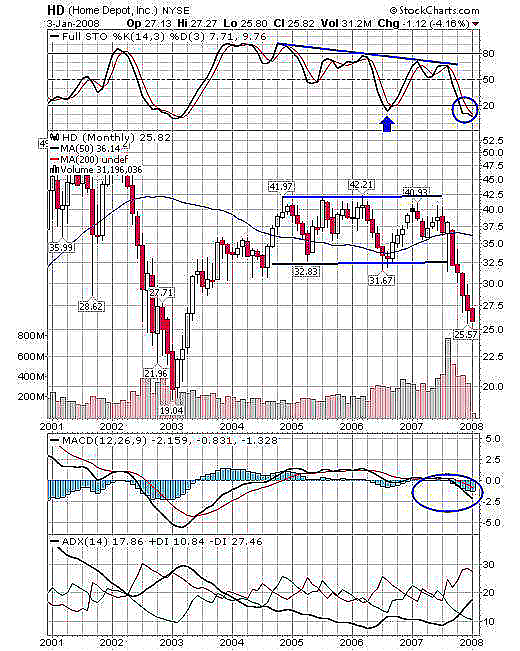
| FIGURE 2: HOME DEPOT, MONTHLY. After violating the lower range support, the stock corrected faster. The indicators show no sign of recovery. |
| Graphic provided by: StockCharts.com. |
| |
| In Figure 2 we can see the stock was consolidating for almost two years in the 31-42 range. The volume during this phase was also satisfactory in light of the previous bullish rally from 19 to 35 from 2003. The sellers' volumes increased as the lower support at 32.5 was taken off and HD turned weak in mid-2007. The stock has already lost 17 from the high (42) and still shows no sign of a pullback rally. |
| The stochastic (14,3,3) is oversold, reaching the level of 9, but no bullish turn can be seen on Figure 2. The MACD (12,26,9) has recently shifted to negative territory so the weakness still prevails. The ADX (14) is very interesting here, as the trend indicators have been declining since 2003, moving below 10 in 2006. The trend was not confirmed with that much of weakness and +DI, -DI battling. This led to a long consolidation on a long-term chart. The ADX (14) above 20 with -DI above +DI would develop the downtrend. |
| Home Depot is still highly bearish and may see some more downfall. |
Active trader in the Indian stock markets since 2003 and a full-time writer. Trading is largely based upon technical analysis.
| Company: | Independent |
| Address: | C1/3 Parth Indraprasth Towers. Vastrapur |
| Ahmedabad, Guj 380015 | |
| E-mail address: | chaitalimohile@yahoo.co.in |
Traders' Resource Links | |
| Independent has not added any product or service information to TRADERS' RESOURCE. | |
Click here for more information about our publications!
Comments
Date: 01/04/08Rank: 3Comment:

Request Information From Our Sponsors
- VectorVest, Inc.
- Executive Premier Workshop
- One-Day Options Course
- OptionsPro
- Retirement Income Workshop
- Sure-Fire Trading Systems (VectorVest, Inc.)
- Trading as a Business Workshop
- VectorVest 7 EOD
- VectorVest 7 RealTime/IntraDay
- VectorVest AutoTester
- VectorVest Educational Services
- VectorVest OnLine
- VectorVest Options Analyzer
- VectorVest ProGraphics v6.0
- VectorVest ProTrader 7
- VectorVest RealTime Derby Tool
- VectorVest Simulator
- VectorVest Variator
- VectorVest Watchdog
- StockCharts.com, Inc.
- Candle Patterns
- Candlestick Charting Explained
- Intermarket Technical Analysis
- John Murphy on Chart Analysis
- John Murphy's Chart Pattern Recognition
- John Murphy's Market Message
- MurphyExplainsMarketAnalysis-Intermarket Analysis
- MurphyExplainsMarketAnalysis-Visual Analysis
- StockCharts.com
- Technical Analysis of the Financial Markets
- The Visual Investor
