

HOT TOPICS LIST
- MACD
- Fibonacci
- RSI
- Gann
- ADXR
- Stochastics
- Volume
- Triangles
- Futures
- Cycles
- Volatility
- ZIGZAG
- MESA
- Retracement
- Aroon
INDICATORS LIST
LIST OF TOPICS
PRINT THIS ARTICLE
by Chaitali Mohile
Just a small twitch and Stanley could rocket back up to its previous high.
Position: Buy
Chaitali Mohile
Active trader in the Indian stock markets since 2003 and a full-time writer. Trading is largely based upon technical analysis.
PRINT THIS ARTICLE
TECHNICAL INDICATORS
Stanley Inc. Ready For Takeoff
01/03/08 03:40:32 PMby Chaitali Mohile
Just a small twitch and Stanley could rocket back up to its previous high.
Position: Buy
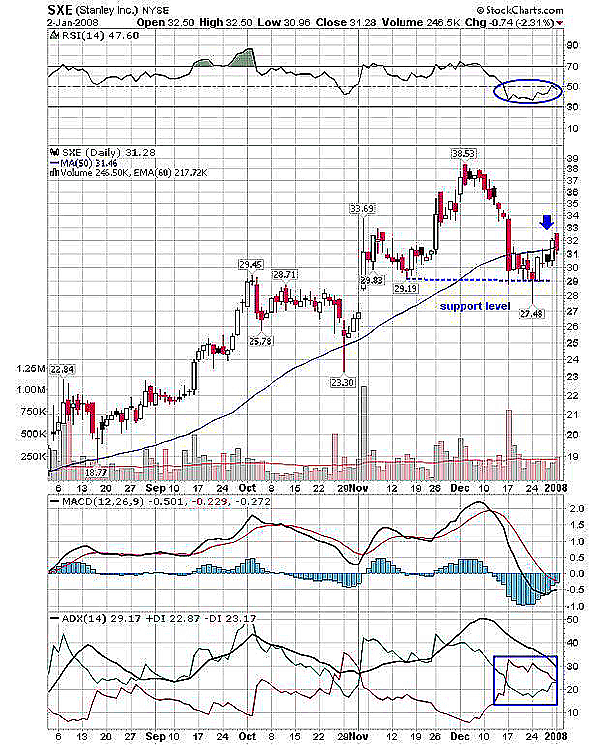
| The newborn baby on NYSE is highly bullish, though it has retraced to its previous support. The stock started its journey from $17 in October 2006 and within a year and half reached $39. Stanley Inc. (SXE) consolidated after every new high made and rallied higher with accumulated strength. Now, the security has retraced back to its previous support area at $29 and is consolidating there. In addition, the stock remained under the pressure of 50. The stock fundamentally is strong, but at its higher price level all the indicators in Figure 1 have reached their extremes. The decline in the indicators creates more room for an upside rally. |
| The relative strength index (RSI) on its way down from the overbought area remained range-bound in 50-30 levels, and so did the price with support at $29 and resistance at $31. The moderate upside surge in the indicator pulled the price above the upper range, closing above the 50-day moving average resistance. The moving average convergence/divergence (MACD) (12,26,9) was high in the positive area, and the decline after the bearish crossover carried the indicators marginally into negative territory. But the positive point is the MACD (12,26,9) is ready to move back in its positive area and may bring the bullish support to the breakout rally. The recent bearish candle is the result of global turbulence. |
|
| FIGURE 1: SXE, DAILY. The closing above upper range and the 50-day moving average resistance gives the bullish indication along with the positive support of indicators. |
| Graphic provided by: StockCharts.com. |
| |
| The average directional movement index (ADX) (14) has declined from the highly overheated level of 50; the uptrend was well developed and strong. As the price corrected, the negative directional index (-DI) became stronger than +DI. But ADX is at 29 and +DI is gaining over the -DI so the uptrend would continue. As the strength comes back in the financial markets, the stock will see a strong upside move. |
|
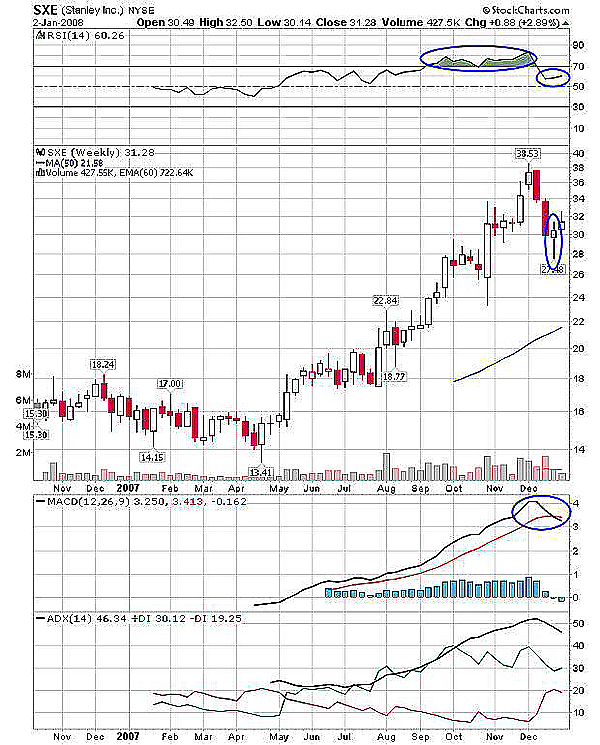
| FIGURE 2: SXE, WEEKLY. The indicators are declining from their higher levels, still withstanding the bullish strength. |
| Graphic provided by: StockCharts.com. |
| |
| The same is the case of indicators on weekly charts. All three indicators have declined from higher areas but have remained bullish. The RSI (14) was highly overbought since October 2007 and still maintaining its overbought levels at 60, thus indicating bullish strength. The MACD (12,26,9) is showing a bearish crossover but in positive territory, so that's again the bullish support. The ADX (14) shows an overheated uptrend, which might get cooled off but the medium-term trend is likely to remain up. |
| After the two long bearish candles, the hammer candlestick is formed. A small upper shadow is valid, and therefore the bullish reversal candlestick pattern banned the downward rally. Technically, the stock has bullish support as seen in the indicators; the stability in the financial markets may add fuel to the rally ahead. The 33 level would be one to watch. |
Active trader in the Indian stock markets since 2003 and a full-time writer. Trading is largely based upon technical analysis.
| Company: | Independent |
| Address: | C1/3 Parth Indraprasth Towers. Vastrapur |
| Ahmedabad, Guj 380015 | |
| E-mail address: | chaitalimohile@yahoo.co.in |
Traders' Resource Links | |
| Independent has not added any product or service information to TRADERS' RESOURCE. | |
Click here for more information about our publications!
Comments
Date:�01/04/08Rank:�3Comment:�

Request Information From Our Sponsors
- StockCharts.com, Inc.
- Candle Patterns
- Candlestick Charting Explained
- Intermarket Technical Analysis
- John Murphy on Chart Analysis
- John Murphy's Chart Pattern Recognition
- John Murphy's Market Message
- MurphyExplainsMarketAnalysis-Intermarket Analysis
- MurphyExplainsMarketAnalysis-Visual Analysis
- StockCharts.com
- Technical Analysis of the Financial Markets
- The Visual Investor
- VectorVest, Inc.
- Executive Premier Workshop
- One-Day Options Course
- OptionsPro
- Retirement Income Workshop
- Sure-Fire Trading Systems (VectorVest, Inc.)
- Trading as a Business Workshop
- VectorVest 7 EOD
- VectorVest 7 RealTime/IntraDay
- VectorVest AutoTester
- VectorVest Educational Services
- VectorVest OnLine
- VectorVest Options Analyzer
- VectorVest ProGraphics v6.0
- VectorVest ProTrader 7
- VectorVest RealTime Derby Tool
- VectorVest Simulator
- VectorVest Variator
- VectorVest Watchdog