HOT TOPICS LIST
- MACD
- Fibonacci
- RSI
- Gann
- ADXR
- Stochastics
- Volume
- Triangles
- Futures
- Cycles
- Volatility
- ZIGZAG
- MESA
- Retracement
- Aroon
INDICATORS LIST
LIST OF TOPICS
PRINT THIS ARTICLE
by Chaitali Mohile
Following three bad trading days, $INDU has slipped below its earlier low. Now what?
Position: N/A
Chaitali Mohile
Active trader in the Indian stock markets since 2003 and a full-time writer. Trading is largely based upon technical analysis.
PRINT THIS ARTICLE
TECHNICAL ANALYSIS
Dow Jones Industrial Average Slips Further
01/03/08 03:31:12 PMby Chaitali Mohile
Following three bad trading days, $INDU has slipped below its earlier low. Now what?
Position: N/A
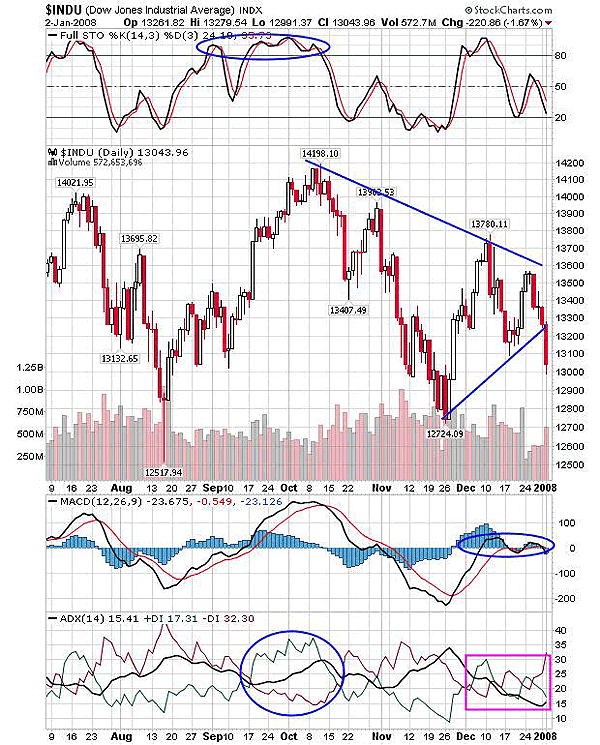
| The first trading day of the new year proved to be rough for most financial markets around the globe. India was the only one among the Asian markets that closed in the black in the Wednesday, January 2nd trading session. $INDU, though, already was in a bad mood, with its chart intending to move in a narrow range after lower highs and higher lows formed in the past many sessions. With the trendline joining these points we got a pattern of a symmetrical triangle, but yesterday's move breached the lower trendline. Due to negative clues from the Asian markets, the index was dragged below the trendline support. We now need to watch out for the next move as the indicators have also turned more bearish. |

|
| FIGURE 1: $INDU, DAILY. As the index slipped under the lower trendline support, the indicators also turned more bearish. |
| Graphic provided by: StockCharts.com. |
| |
| The stochastic (14,3,3) is close to the 20 level and indicates some more downside left to hit the oversold area. In addition, the moving average convergence/divergence (MACD) (12,26,9) that was already volatile near its trigger line is on edge to cross over its zero line and enter the negative territory. Therefore, both indicators suggest there is still more downside left. Meanwhile, the sellers' pressure on average directional movement index (ADX) (14) increased massively, though the trend is neutral, indicating the possibility of consolidation after the 200-point fall. With these conditions, we need to watch the next support level; if the index gets back to trendline support, then a range-bound move with the upper trend line as resistance is possible. It's just a matter of waiting patiently. See Figure 2. |

|
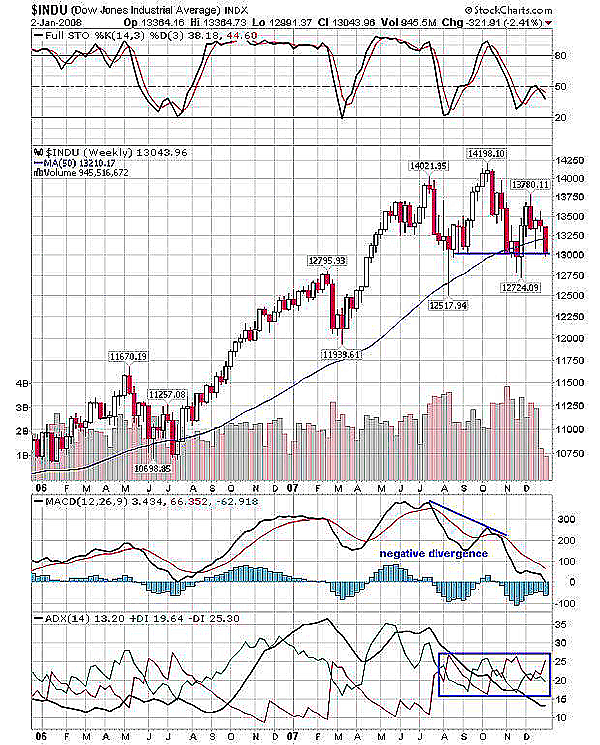
| FIGURE 2: $INDU, WEEKLY. The previous support level of 13000 was held and the indicators were still bearish, so the next support level must be observed. |
| Graphic provided by: StockCharts.com. |
| |
| The MACD (12,26,9) plunged from as high as the 300-plus level to the lowest near zero line. During this time the index made new highs. This created a negative divergence, which points toward a correction in the near future. Accordingly, the index entered the bad phase and tumbled nearly 1,000 points, establishing support below 13000, below a 50-day moving average. With support at 12724, the index reached a lower high at 13780; now the index is back below the 50-day MA again and stands on the support of 13000. Traders to be more cautious at these levels. |
| The stochastic (14,3,3) is still declining and has moved below 50, and in addition, the ADX (14) at 13000 shows weakness in trend with -DI ready to surge. All the three indicators on the weekly chart in Figure 2 show a negative bias. |
| You don't have to trade every day. On some days you may be forced to just watch the markets as is the case with the $INDU today. |
Active trader in the Indian stock markets since 2003 and a full-time writer. Trading is largely based upon technical analysis.
| Company: | Independent |
| Address: | C1/3 Parth Indraprasth Towers. Vastrapur |
| Ahmedabad, Guj 380015 | |
| E-mail address: | chaitalimohile@yahoo.co.in |
Traders' Resource Links | |
| Independent has not added any product or service information to TRADERS' RESOURCE. | |
Click here for more information about our publications!
Comments
Date: 01/04/08Rank: 5Comment: this guy s always on the money
Date: 01/07/08Rank: 5Comment:
Date: 01/07/08Rank: 5Comment:

Request Information From Our Sponsors
- StockCharts.com, Inc.
- Candle Patterns
- Candlestick Charting Explained
- Intermarket Technical Analysis
- John Murphy on Chart Analysis
- John Murphy's Chart Pattern Recognition
- John Murphy's Market Message
- MurphyExplainsMarketAnalysis-Intermarket Analysis
- MurphyExplainsMarketAnalysis-Visual Analysis
- StockCharts.com
- Technical Analysis of the Financial Markets
- The Visual Investor
- VectorVest, Inc.
- Executive Premier Workshop
- One-Day Options Course
- OptionsPro
- Retirement Income Workshop
- Sure-Fire Trading Systems (VectorVest, Inc.)
- Trading as a Business Workshop
- VectorVest 7 EOD
- VectorVest 7 RealTime/IntraDay
- VectorVest AutoTester
- VectorVest Educational Services
- VectorVest OnLine
- VectorVest Options Analyzer
- VectorVest ProGraphics v6.0
- VectorVest ProTrader 7
- VectorVest RealTime Derby Tool
- VectorVest Simulator
- VectorVest Variator
- VectorVest Watchdog
